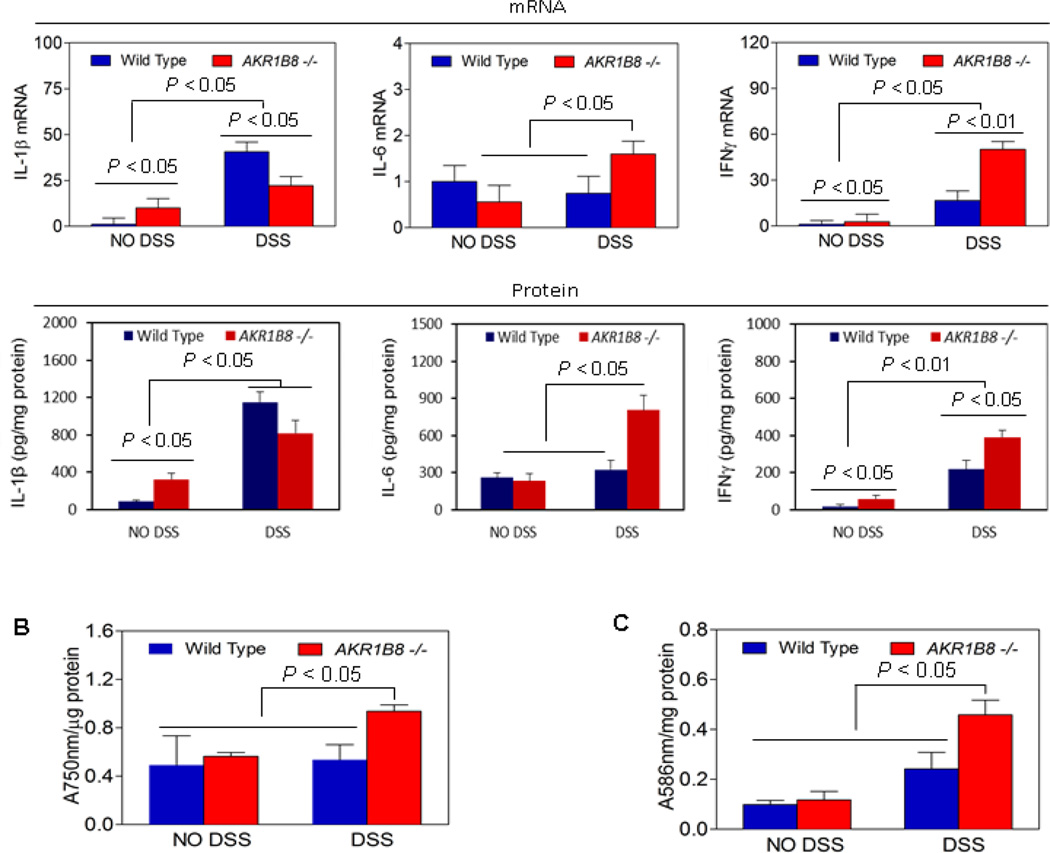
Figure 4. Proinflammatory cytokines, oxidative stress, and carbomyl levels in AKR1B8 −/− mice.
(A) Expression of cytokines IL-1β, IL-6, and IFNγ. Upper panel: mRNA levels; lower panel: protein levels. Data indicate mean ± SD, n= 5. (B) Oxidative stress (n=5 each). (C) Lipid peroxides (n=5 each). Statistical significance was tested by Student’s t test.

