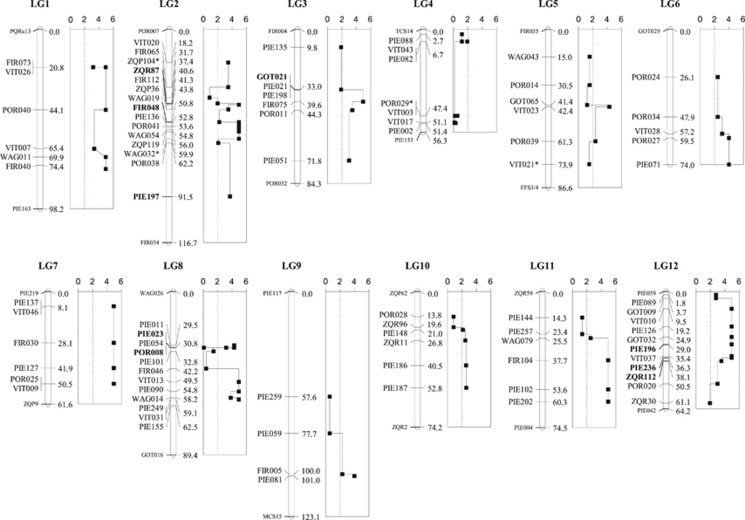
Figure 3.
Score tests for association between consecutive two-marker haplotypes and the binary character ‘species' (sliding-window analysis). The plots to the right of each LG show the association P-values (logarithmic scale) for each segment. The dotted lines mark the significance limit (P=0.01). Probabilities equal to 0 were arbitrarily assigned logarithmic values of 5.5 (should be ∞). Bold type markers correspond to positive selection outliers, whereas balancing selection outliers were identified with an asterisk. LG ends that were not genotyped in our study (markers with smaller font size) have been included for reference.

