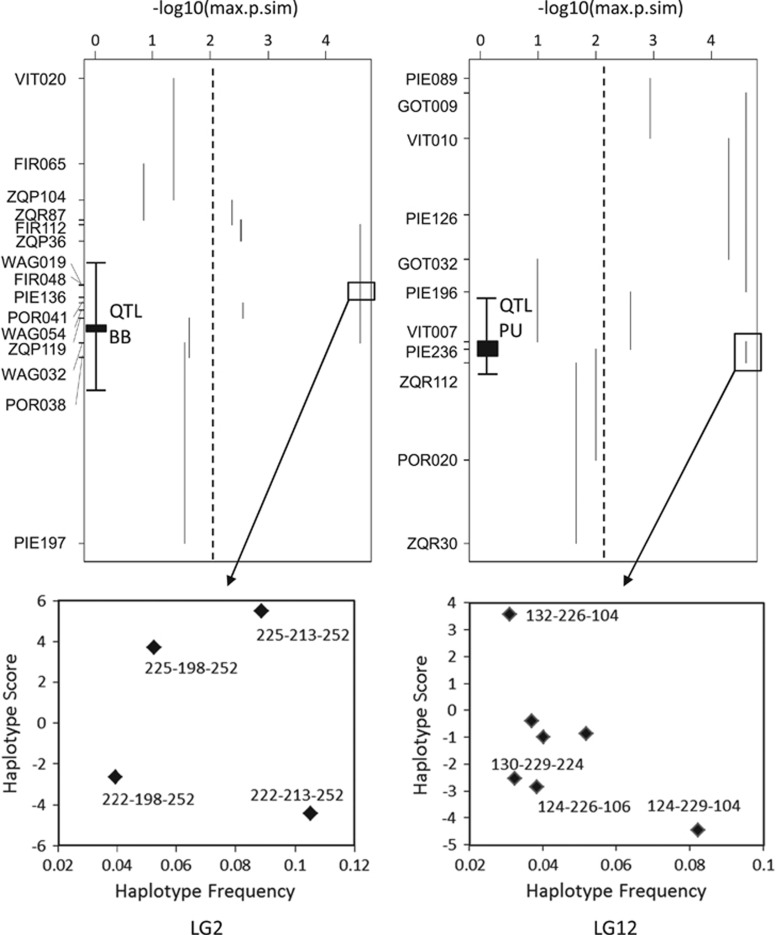
Figure 4.
Score tests for association between consecutive three-marker haplotypes from LG2 and LG12, and the character ‘species'. The association P-values (logarithmic scale) are shown by vertical lines spanning the positions of the three-marker haplotypes. Dotted lines show the significance limits (P=0.01). Probabilities equal to 0 were assigned logarithmic values of 4.5 (should be ∞). Markers on the Y axes were placed according to genetic distances in the composite map. The positions of the bud burst (BB) and pubescence (PU) QTLs were approximately projected into the SSRs map with the aid of shared markers. The two bottom charts show three-marker haplotype-specific scores from two regions that contain outliers, QTLs involved in ecological divergence and highly significant associations: WAG019-FIR048-PIE136 (LG2) and VIT007-PIE236-ZQR112 (LG12). Positive and negative scores indicate associations to Quercus faginea and Q. pyrenaica, respectively; whereas labeled haplotypes show significant associations.

