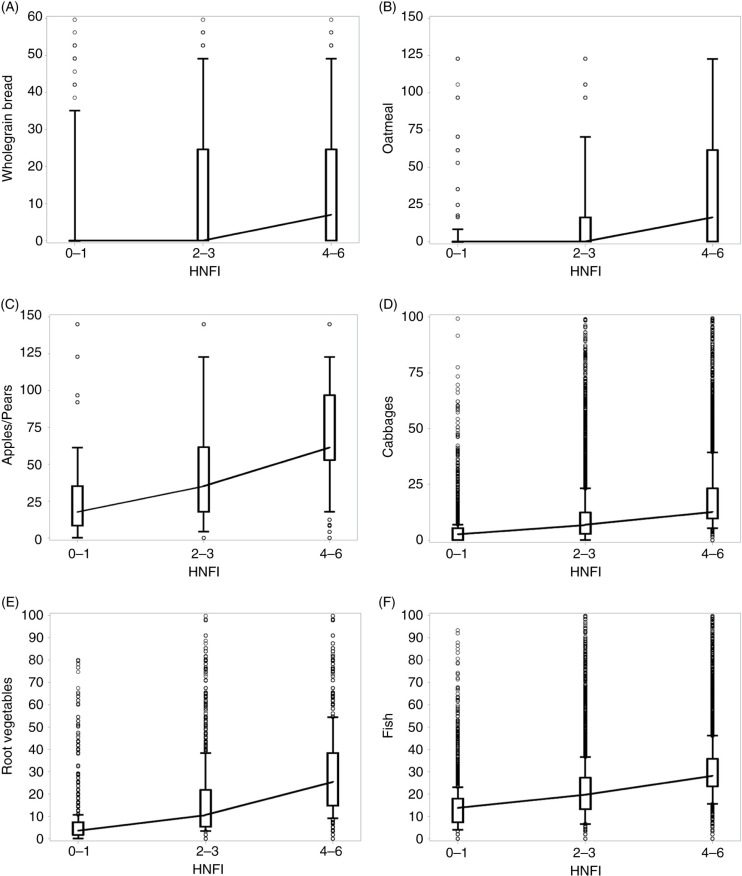
Fig. 1.
Box-plot distribution of intake of food groups (g/day) included in the healthy Nordic food index by HNFI adherence groups: low (0–1), medium (2–3), and high (4–6). Sub-panels, (A) Wholegrain bread, (B) oatmeal, (C) apples/pears, (D) cabbages, (E) root vegetables, (F) fish. HNFI=healthy Nordic food index. Boxes between 25th and 75th percentiles; joined medians; whiskers between 10th and 90th percentiles; individuals values as dots.

