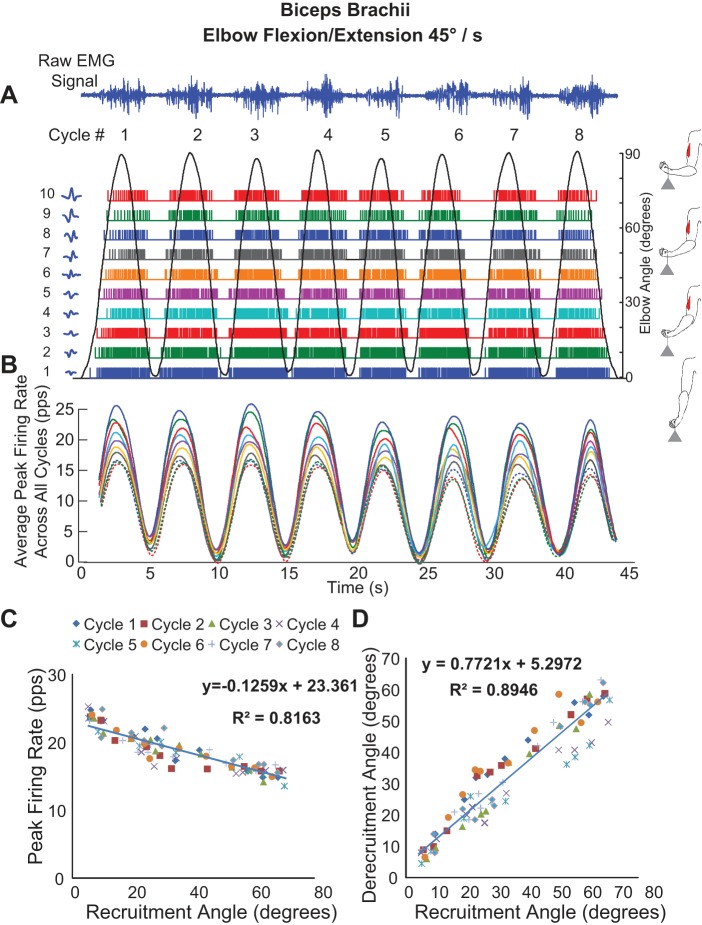
Fig. 6.
Decomposition of sEMG data recorded from 1 subject during a multicycle contraction of the biceps brachii muscle (8 cycles) during repetitive elbow flexion/extension at an angular velocity of 45°/s. A: the sEMG signals and firing instances of MUAPTs derived from decomposing these signals are shown for changes in elbow angle (black sinusoidal line). The MUAP waveform templates obtained at recruitment are shown adjacent to the y-axis for each train. B: the mean firing rate values of the firing instances shown in A (MUAPTs 1–7 are shown as solid colored lines, and MUAPTs 8–10 are shown as dotted colored lines). C: the peak firing rate values are plotted vs. the angle at which the MUAPT was recruited and derecruited. The results of a linear regression analysis of the data are shown. D: the angle at which each MU is recruited is plotted vs. the angle at which it is derecruited. The results of a linear regression analysis of the data are shown. pps, Pulses per second.

