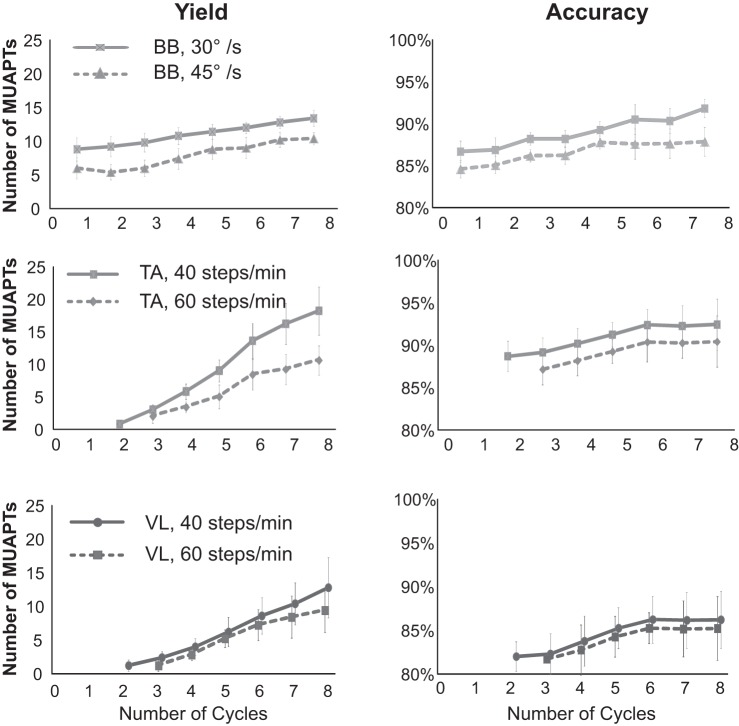
Fig. 8.
Decomposition algorithm performance is shown as a function of contraction cycle for the 3 muscles studied (BB, biceps brachii; TA, tibialis anterior; and VL, vastus lateralis). Data for each contraction cycle is plotted as mean values with SD bars for all subjects tested for all contractions. Data are plotted separately for the 2 different elbow contraction speeds (top plots) and walking speeds (2 bottom plots). Accuracy is calculated using the DSDC method.

