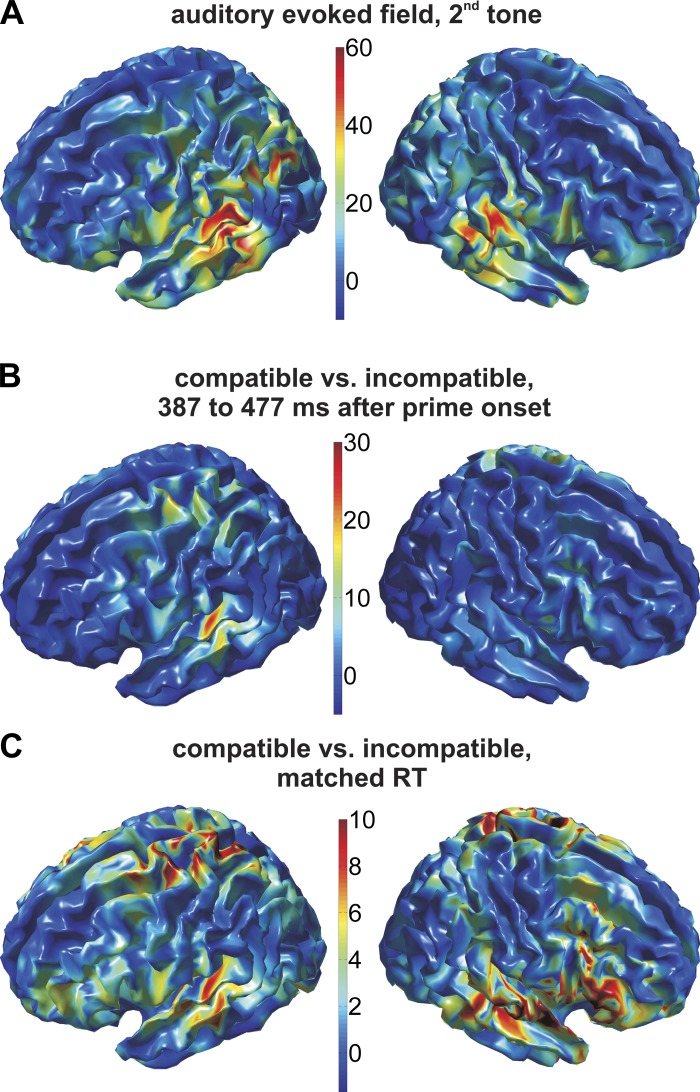
Fig. 3.
Source-level topographies of the compatibility effect and of the auditory localizer. Color codes F-values. Left column: lateral view on the left hemisphere; right column: lateral view on the right hemisphere. A: source-level topography of the auditory localizer, with the same time window as in Fig. 2B. B: source-level topography of the prime-target compatibility effect between 387 and 477 ms after prime onset. C: source-level topography of the prime-target compatibility effect, after matching trials for RT across priming conditions, between 413 and 463 ms after prime onset. Differences between time windows in B and C and Fig. 2A reflect slight variations in the temporal extent of clusters identified by cluster-based permutation testing, i.e., are purely data-driven (see methods). The topography of the prestimulus prime-target compatibility effect (B) overlaps with the auditory localizer (A) in left auditory cortex, irrespective of any differences in RT across conditions (C).

