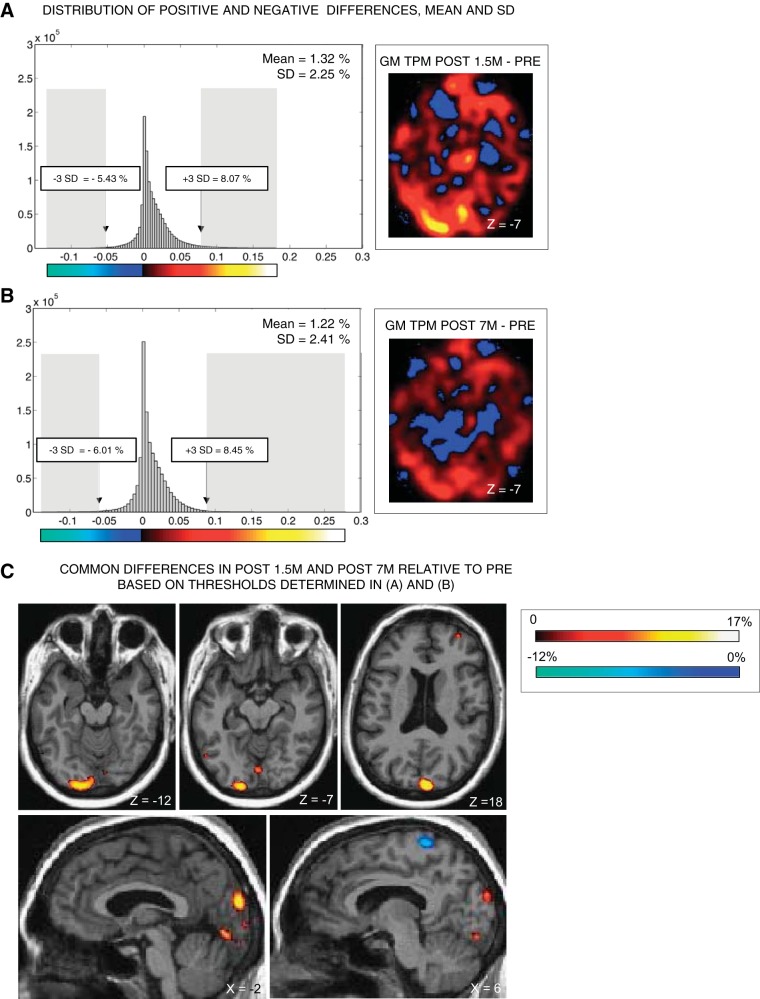
Fig. 2.
Voxel-based morphometry (VBM) analyses and results. A and B: VBM analyses in KL. The smoothed gray matter tissue probability map (GM TPM) obtained at Pre was subtracted from the smoothed GM TPM obtained at Post 1.5m (A) and at Post 7m (B). Thresholds for significant differences were established based on the mean and SDs of the distribution of positive and negative differences observed in the differential image obtained in A and B. C: only voxels showing common between-session differences above or below 3 SDs from the mean of the distribution in A and B are reported, by overlapping the thresholded differential image on KL's native anatomical image.

