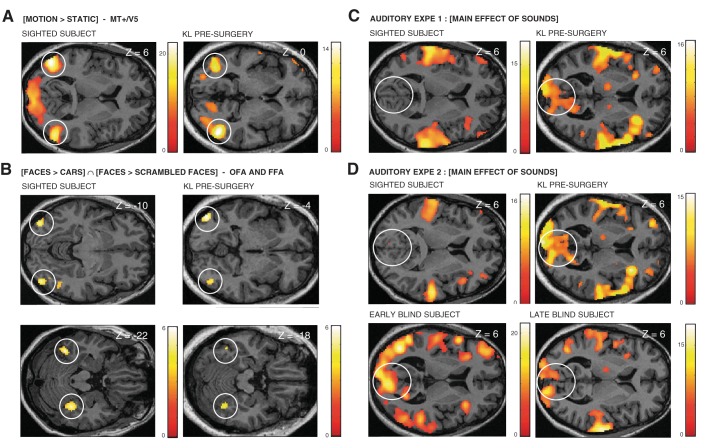
Fig. 7.
fMRI activation maps in control subjects. A and B: brain regions responding more to moving relative to stationary dots (A) and Faces relative to both Cars and Scrambled Faces (B) are shown in a representative subject from the sighted control group (right-handed woman, 32 yr old) and in KL before surgery. C: brain regions responding during global sound processing in auditory experiment 1 ([Motion + Voice]) are shown in a representative subject from the sighted control group (right-handed woman, 32 yr old) and KL before surgery. D: brain regions responding during global sound processing in auditory experiment 2 ([Spatial + Pitch]) are shown in a representative subject from the sighted control group (right-handed woman, 48 yr old), a representative subject from the early-blind group (right-handed woman, 56 yr old), a representative subject from the late-blind group (right-handed woman, 46 yr old), and KL before surgery. Results are displayed at a threshold P < 0.05 corrected (FWE) over the whole brain in A, C, and D and at a threshold of P < 0.001 uncorrected in B on transverse slices of each subject's structural image normalized to MNI space.

