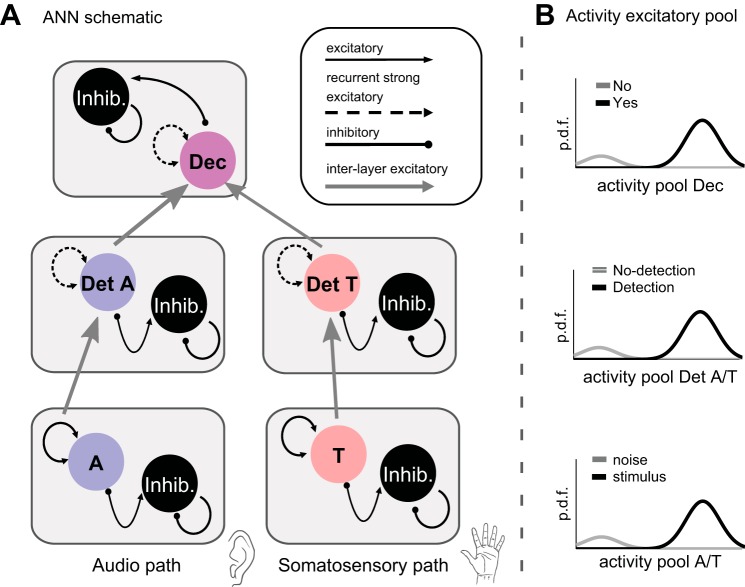
Fig. 4.
A: schematic representation of the proposed attractor neural network (ANN) for bimodal detection. The gray rectangles represent the different modules: sensory (audio and somatosensory, labeled A and T), detection related (audio and somatosensory, labeled Det A and Det T) and decisional stage (Dec). Black circles represent the inhibitory pools of neurons; blue, red, and purple circles represent the excitatory pools respectively for the audio, somatosensory, and the compound decisional stage. Between the modules the synapses connect uniquely excitatory-excitatory neurons (light grey arrows). The excitatory recurrent synapses are differentiate qualitatively into strong (detection and decisional stage) and weak (sensory stage). B: probability distribution function (p.d.f.) of the activity of the excitatory pools (A, T, Det A, Det T, and Dec) of the different layers. Excitatory pools A and T, as well as Det A and Det T, have the same qualitative behavior, and are collapsed in a unique graph. Pools A and T have higher activity when the stimulus is present (stimulus) then when it is not (noise). The p.d.f.s of the activity of Det A and Det T are plotted for the 2 possible observer internal states. Their activity is usually higher when the stimulus is detected (detection) then when it is not (no-detection). The p.d.f. for the Dec pool is depicted for the 2 possible outcome of the whole net: No and Yes. Its activity is usually higher when the answer is Yes then when it is No.

