
Fig. 5.
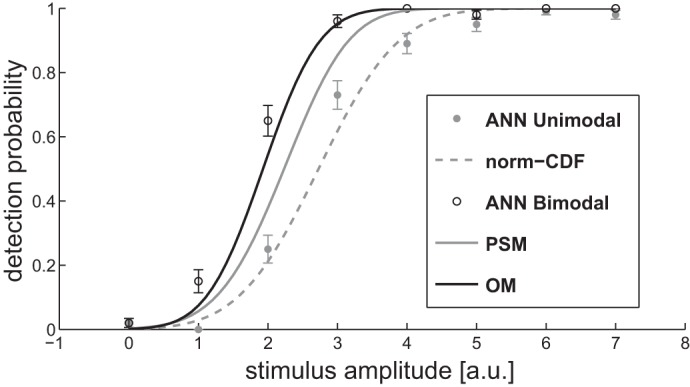
Psychophysical curves of detection probability calculated with the 3-stage ANN model (sensory, detection, and decision) for a single modality (ANN Unimodal, gray circles) and for a compound stimulus (ANN Bimodal, empty circles). The dashed line is the fit with a normal cumulative distribution for the detection probability for the ANN unimodal (gray dashed line); the continuous lines are respectively the prediction for the PSM (gray) and for the OM (black) given the same unimodal detection probabilities of the ANN unimodal.