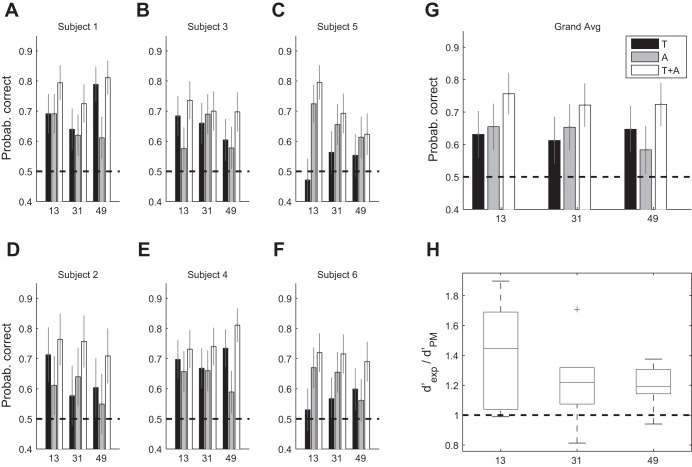
Fig. 6.
Results from experiment 1. A–F: individual probabilities of correct answers for the different frequencies (13, 31, and 49 Hz) in the 3 conditions, T, A, and A + T, respectively, in black, gray, and white. G: interobserver averages of the probability of correct answers. Horizontal dashed lines for the A–G are the chance level for the proportion of correct. Error bars are the SE. H: boxplot d′-ratio of the observed (d′exp) over the PM (d′PM) predictions. On each box, the central mark is the median, the edges of the box are the 1st and 3rd quartiles, the whiskers extend to the most extreme data points, that is within 1.5 interquartile range below and above the lower and upper quartile, respectively; the outliers are plotted individually with crosses.

