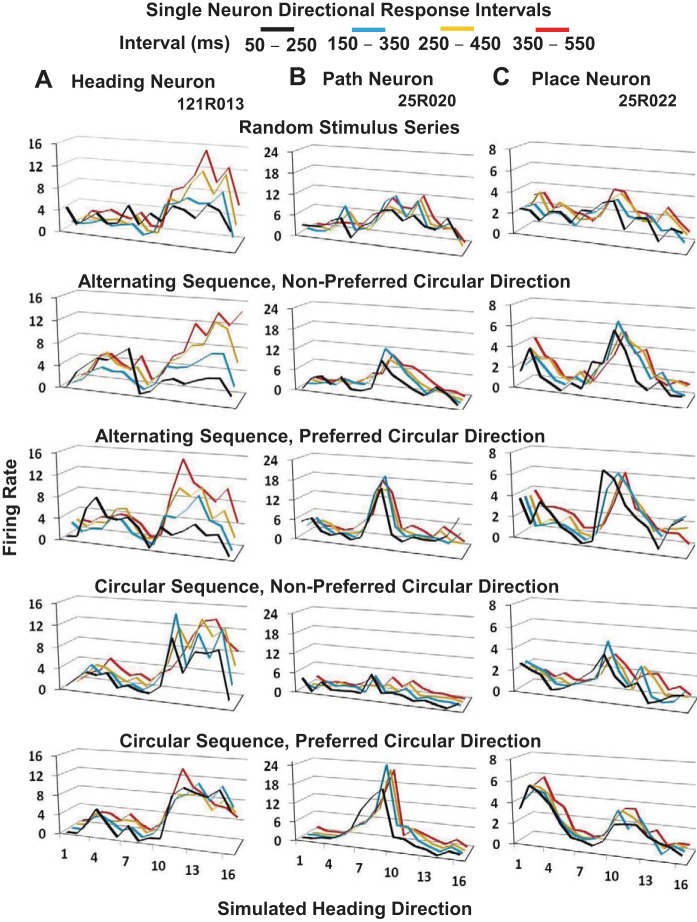
Fig. 6.
Temporal dynamics of responses in three optic flow stimulus conditions can distinguish heading, path, and place neurons. Each of the 500-ms stimulus periods was divided into four 100-ms offset response intervals (see key to colored lines). A: heading neuron shows the gradual increase of its response amplitudes across the 500 ms of stimulus presentation in the random stimulus condition. B: path neuron shows lower peak firing rates in the random stimulus condition contrasted with the rapid rise of larger response amplitudes in the preferred circular conditions, with greatly diminished responsiveness in the nonpreferred circular condition. C: place neuron shows lower peak firing rates in the random stimulus condition contrasted with the rapid rise of its dual peak response amplitudes in the preferred circular conditions, with a single peak in the nonpreferred circular condition.

