Fig. 11.
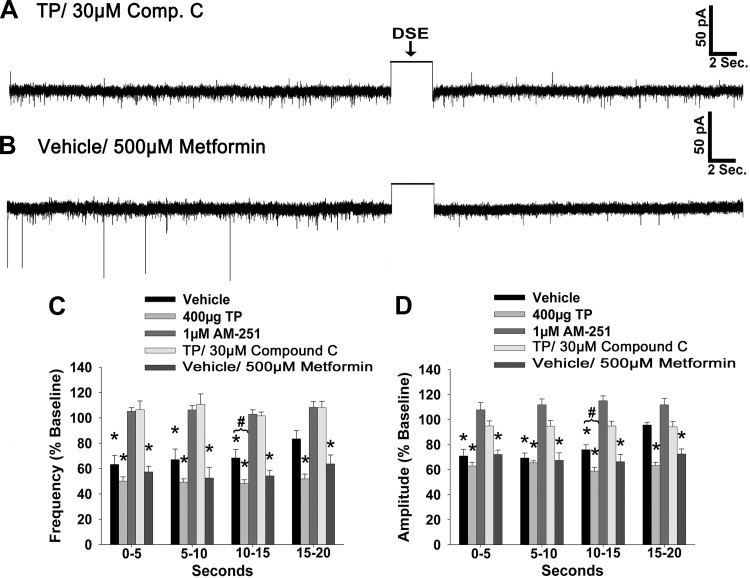
The AMPK inhibitor compound C (Comp. C) attenuates DSE in POMC neurons from TP-treated animals, whereas the AMPK activator metformin enhances DSE in POMC neurons from vehicle-treated animals. A and B: representative membrane current traces illustrating the changes in sEPSC frequency and amplitude elicited by DSE during recordings in slices from TP-treated animals that were pretreated with 30 μM of Comp. C (A) and in slices from vehicle-treated animals that were pretreated with 500 μM of metformin (B). The rectangular wave under the arrow labeled DSE represents the truncated change in membrane current caused by the 3-s, 60-mV depolarizing voltage command. C and D: composite bar graphs illustrate the DSE-induced changes in sEPSC frequency and amplitude, respectively, observed during the various treatment conditions. Bars and vertical lines represent means and 1 SE, respectively. *Values of poststimulus sEPSC frequency and amplitude that are significantly different (P < 0.05, Kruskal-Wallis/median-notched box-and-whisker analysis; n = 4–8) from those observed under basal conditions; #values of poststimulus sEPSC frequency and amplitude observed during recordings from TP-treated slices that were significantly different (P < 0.05, Kruskal-Wallis/median-notched Box-and-Whisker analysis; n = 4–8) from those from vehicle-treated slices.

