
Fig. 3.
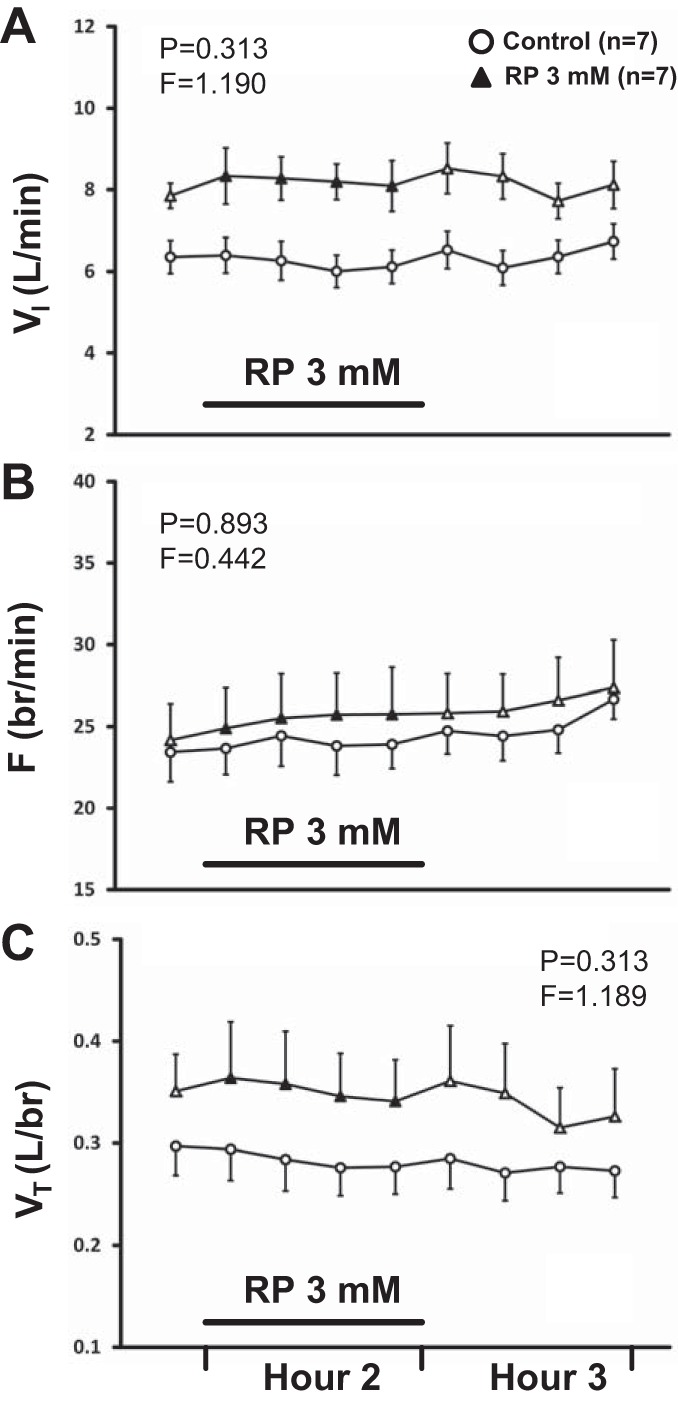
The effect on breathing over time of dialysis of 3 mM RP67580 (RP) (n = 7) in the day was not significantly different (P ≥ 0.313) from the effect of time control studies (n = 7). A: VI (liter/min); B: F (br/min); C: VT (liter/br). First data point represents last bin of Hour 1. Closed symbols and bar indicate period of RP dialysis (Hour 2); open symbols indicate mCSF dialysis. F and P indicate values for interaction term from two-way RM ANOVA (see methods for further details on statistical analysis).