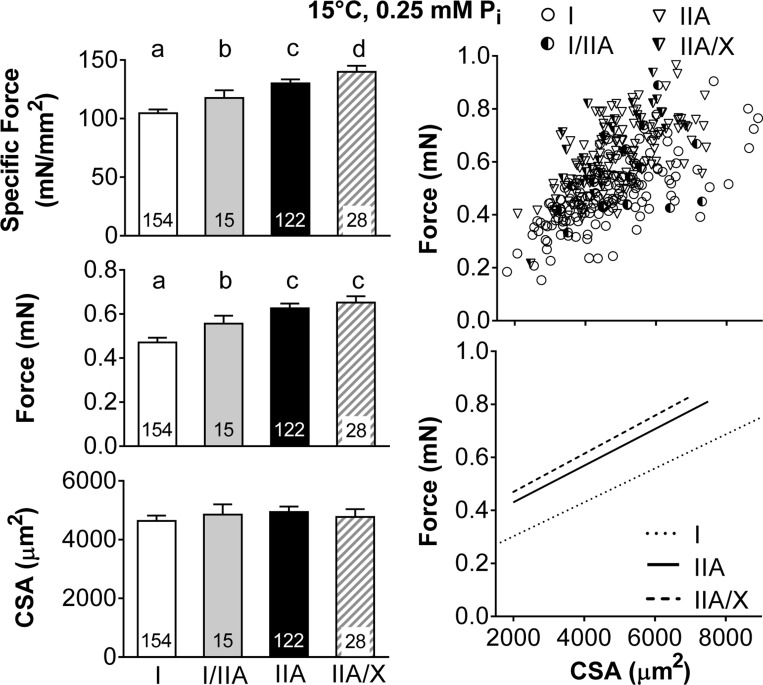
Fig. 1.
Single skeletal muscle fiber maximum Ca2+-activated (pCa 4.5) specific force, force, and cross-sectional area (CSA) by fiber type at 15°C and 0.25 mM Pi. Left: average values, with number of fibers indicated at the base of each bar. Where fiber type effects were observed, different letters above bars identify pair-wise differences (P ≤ 0.05) between fiber types. Right: scatterplots, with each point representing an individual fiber. Lines indicate linear regressions for MHC I, IIA, and IIA/X fibers from raw data in scatterplots, with Pearson's correlation coefficients (r) = 0.705, 0.622, and 0.566, respectively, and all coefficients significant at P < 0.01. Number of fibers was inadequate to calculate linear regression of MHC I/IIA fiber force with CSA.

