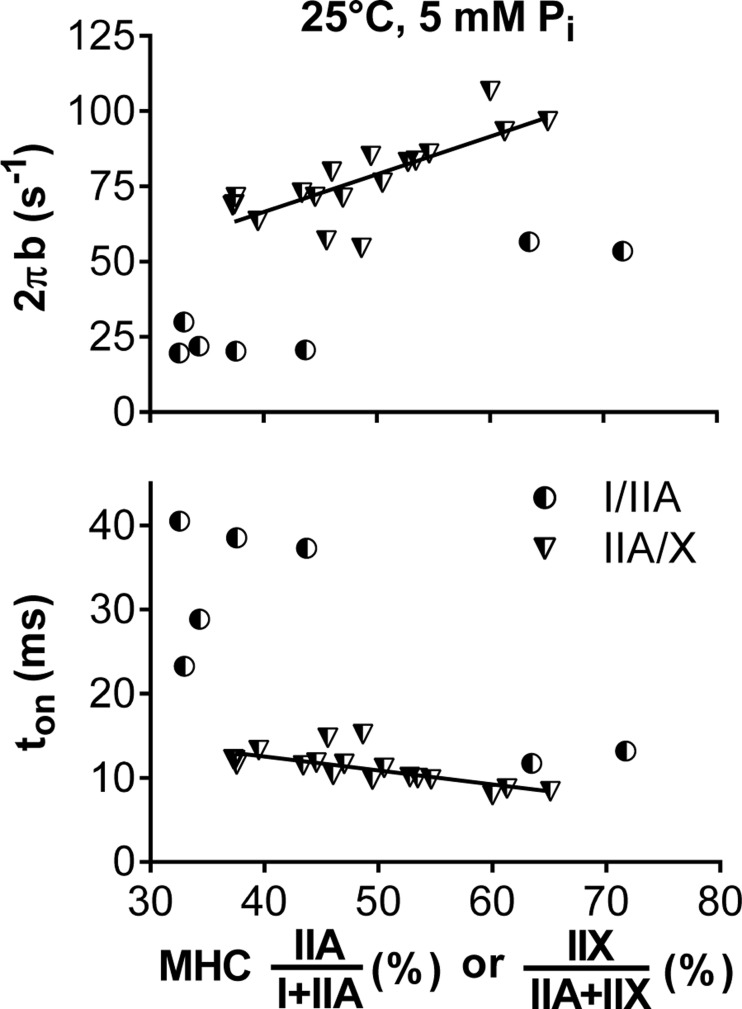
Fig. 4.
Changes in myosin-actin cross-bridge kinetics with isoform concentration in MHC I/IIA and IIA/X fibers. Increasing values on the x-axis represent percentage of the faster MHC isoform (IIA for I/IIA and IIX for IIA/X fibers). Lines indicate linear regressions for 2πb (r = 0.769, P < 0.01) and ton (r = −0.689, P < 0.01) from MHC IIA/X fibers. Linear regressions were not determined from MHC I/IIA fibers, as percent MHC values were either high or low, with no clear relationship between them.

