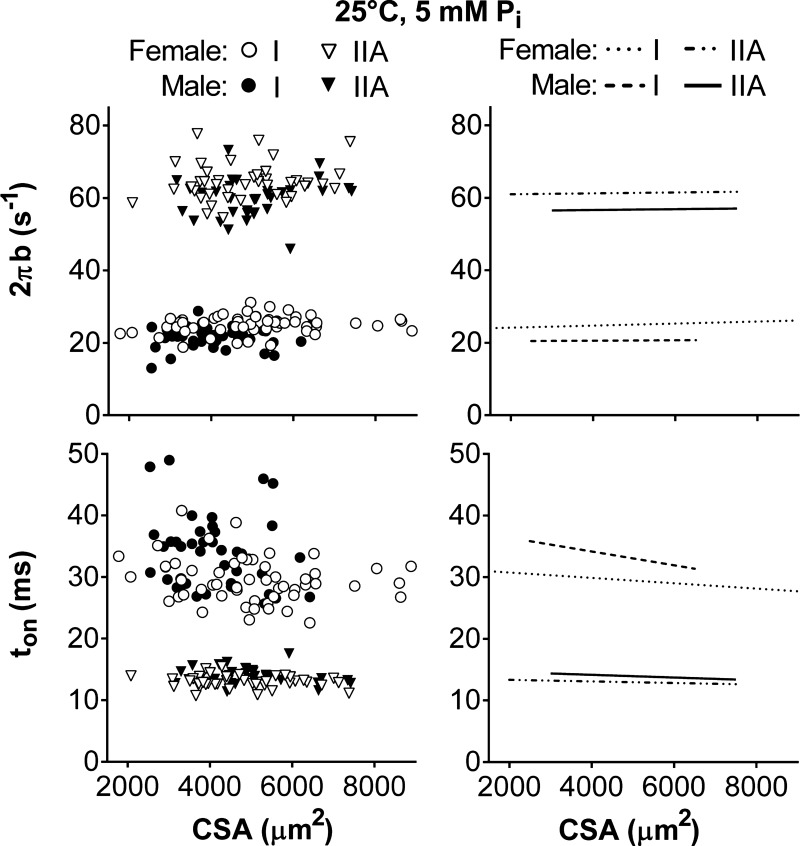
Fig. 7.
Relationship between cross-bridge kinetics (2πb and ton) and CSA for men and women in MHC I and IIA fibers at 25°C, pCa 4.5, and 5 mM Pi. Data points represent results from an individual fiber. Lines indicate linear regressions. Myosin-actin cross-bridge kinetics (2πb and ton) did not change with CSA, as their slopes were not different from zero.

