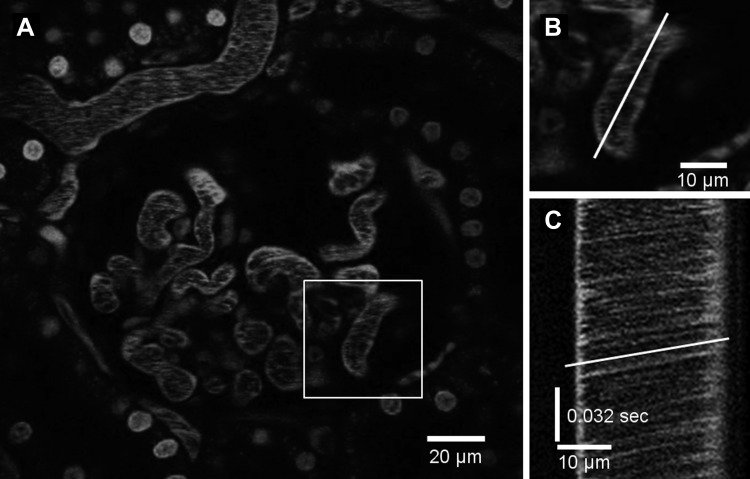
Fig. 1.
A: fluorescence micrograph of a glomerulus after injection of high-molecular-weight (150 kDa) rhodamine-dextran. Cell nuclei are stained with Hoechst. B: line scan location for generating the time-distance image. C: line scan image of time (t) − distance (d). The black streaks indicate red blood cells moving through the vessel. The slope of the streaks (white line) is used to calculate the centerline velocity.

