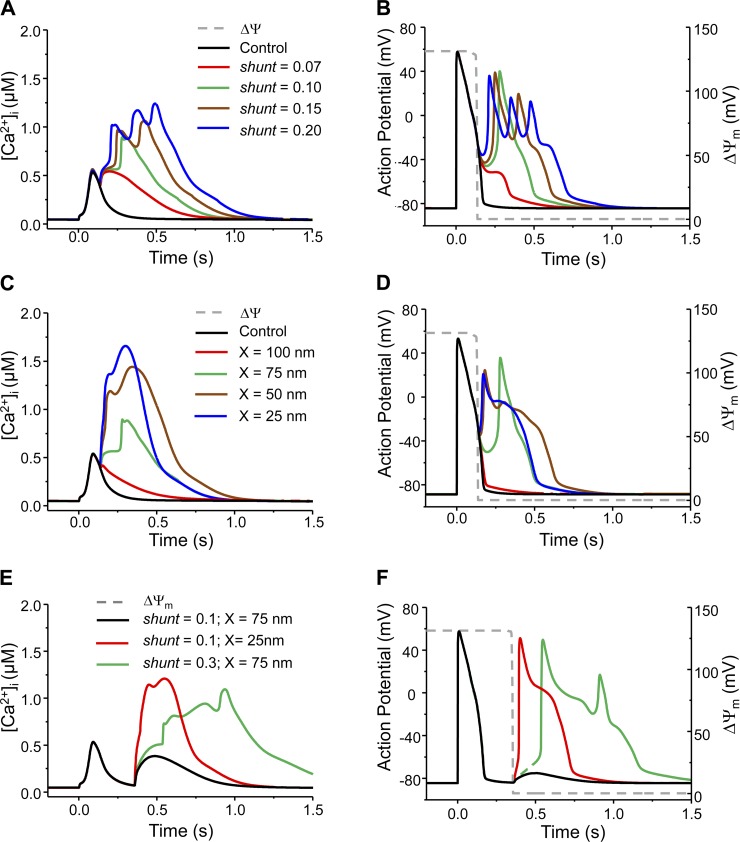
Fig. 6.
Model simulated effect of mdO2·− production rate (shunt) or mitochondrion-SR distance (X) on the mdO2·−-mediated Ca2+ transient and AP alteration. A and B: increasing shunt caused higher Ca2+ elevation and converted normal AP to APD prolongation, single EAD and eventually multiple EADs. In these simulations, X = 75 nm. C and D: decreasing X had a similar effect on Ca2+ elevation and AP as increasing shunt. In these simulations, shunt = 0.10. E and F: effects of shunt and/or X on the phase 4 mdO2·− burst-induced Ca2+ elevation and AP abnormality. Increasing shunt from 10 to 30% or reducing X from 75 to 25 nm caused extraordinary increase of [Ca2+]i and translated DAD to triggered activity. The dash gray lines represent ΔΨm and its depolarization represents the acute mdO2·− burst.

