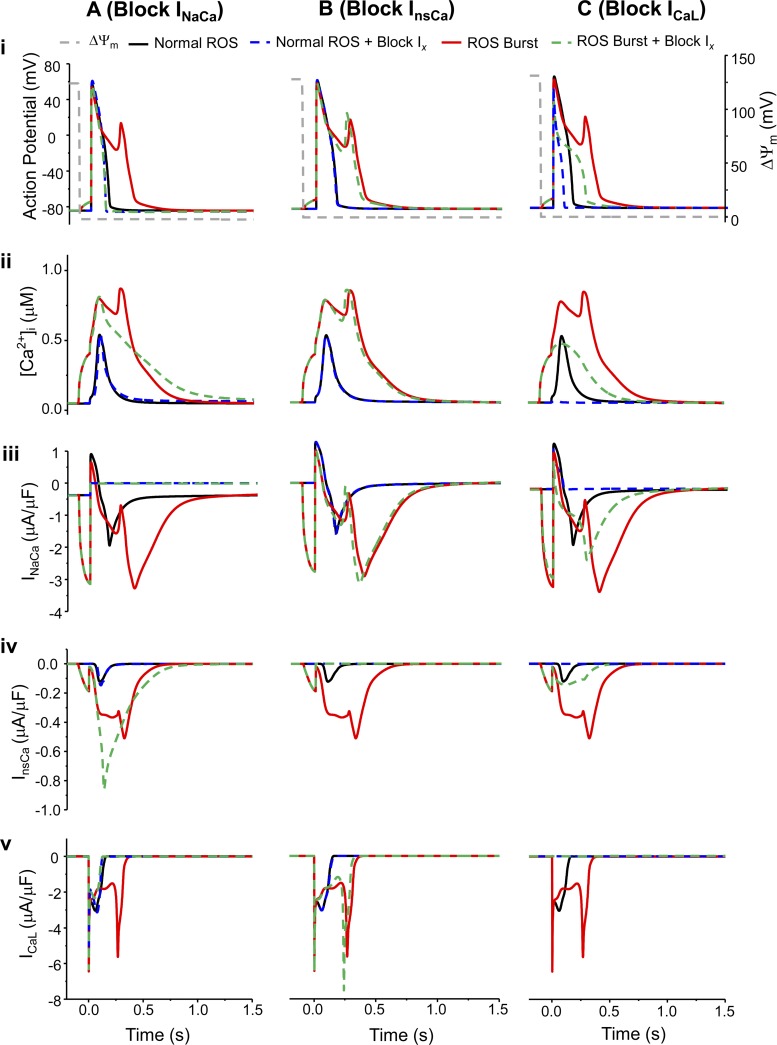
Fig. 7.
Model simulated effects of blocking INaCa (A), InsCa (B), or ICaL (C) on AP (i), Ca2+ transient (ii), INaCa (iii), InsCa (iv), and ICaL (v) under control and mdO2·− burst conditions. In the legend, Ix represents INaCa (Ai-Av), InsCa (Bi-Bv), or ICaL (Ci-Cv), respectively. The dash gray lines represent ΔΨm and its depolarization represents the acute mdO2·− burst.

