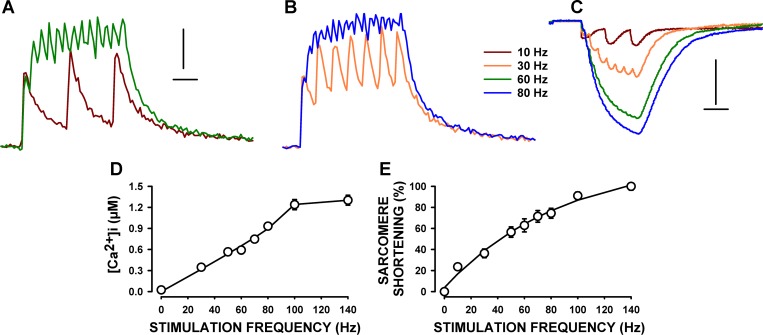
Fig. 8.
Frequency-[Ca2+]i and frequency-sarcomere shortening relationships in single FDB fibers. Fibers were prepared and tested according to protocol 2. Examples of [Ca2+]i (A and B) and sarcomere length (C) during tetanic contractions. Horizontal lines represent 100 ms, while vertical lines represent 0.2 μM (A and B) and 0.2 μm (C). D: [Ca2+]i-stimulation frequency relationship (data at 10 Hz not included because of the individual Ca2+ peaks). E: frequency-sarcomere shortening relationship. Sarcomere shortenings were calculated as the difference between unstimulated and tetanic sarcomere length and are expressed as a percentage of the shortening at 140 Hz. Error bars, which, here, are smaller than the symbols, represent the means ± SE of six fibers from four mice.

