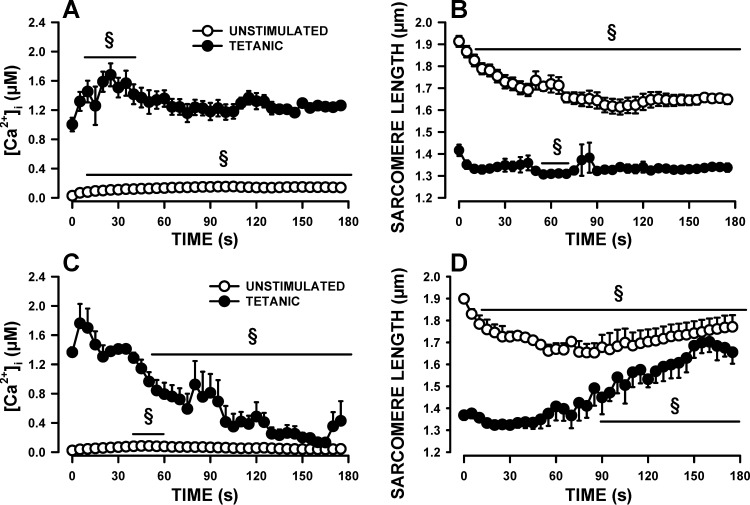
Fig. 9.
Changes in [Ca2+]i and sarcomere length during fatigue. Fibers were prepared and tested as per protocol 2. Fatigue was elicited with one 200-ms tetanic contraction every second for 3 min; data are shown every 5 s. Changes in unstimulated and tetanic [Ca2+]i (A) and sarcomere length (B) in the more fatigue-resistant fibers. Changes in unstimulated and tetanic [Ca2+]i (C) and sarcomere length (D) in the less fatigue-resistant fibers. Error bars represent means ± SE of three fibers for each category of fatigue-resistant fibers from four mice. §Mean value significantly different from the mean value before fatigue (time 0; using ANOVA and LSD, P < 0.05).

