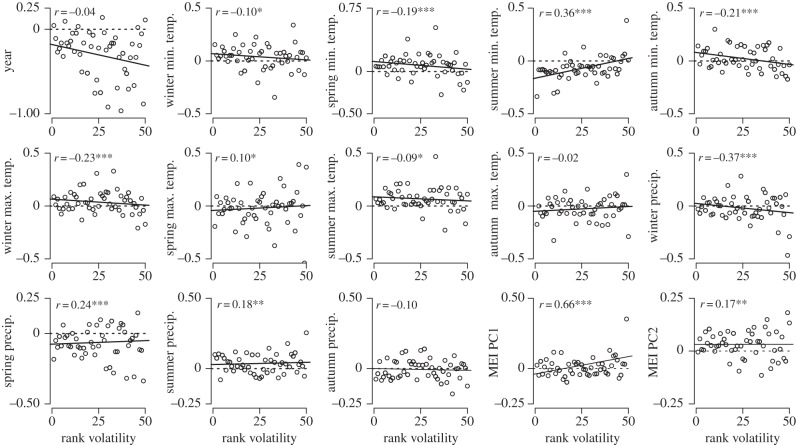
Figure 2.
Rank volatility is plotted against species-specific point estimates (open circles) of regression coefficients describing the impact of model variables. Correlation coefficients describe the differential impact of each variable across the spectrum of volatility. This illustrates which weather variables influence volatile species differently from stable species. The variables ‘MEI PC1’ and ‘MEI PC2’ are composite variables that act as indices of the El Niño Southern Oscillation. Trendlines (solid) and zero lines (dotted, showing where coefficients are equal to zero) are plotted for visualization. *Certainty of non-zero correlation >85%, **>95% and ***>99%.

