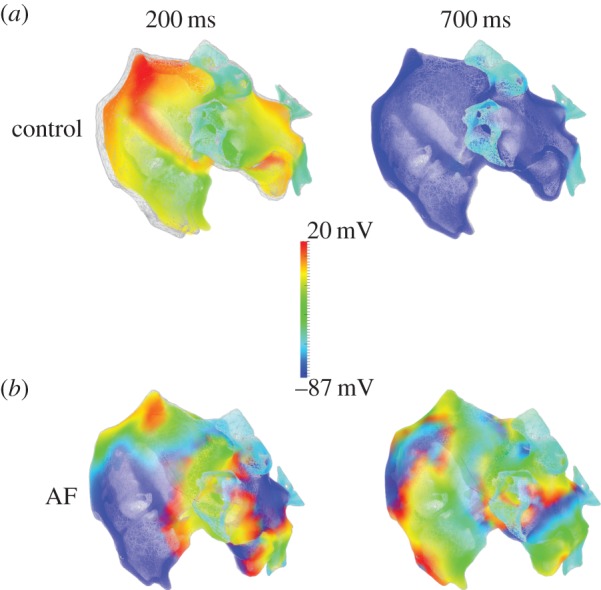
Figure 1.

Simulated electrical and mechanical activities of the human atria during control and chronic atrial fibrillation conditions. Atrial electrical excitation waves are presented by colour coded cellular action potentials (see colour key), and mechanical contraction is represented by superimposition of the atrial mesh on its original geometry (grey; i.e. the geometry before electrical activation). (a) Snapshots of atrial electromechanical activity at 200 ms (during contraction) and 700 ms (after repolarization and tissue relaxation). (b) During atrial fibrillation (AF), showing negligible contraction and multiple re-entrant wavelets which are maintained and persist at 700 ms. (Figure was produced by Dr Ismail Adeniran and H.Z.)
