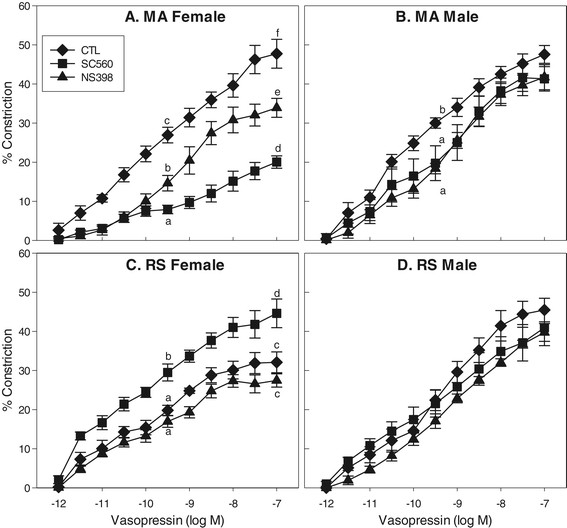
Figure 2.

VP concentration-response curves in MCA segments in the absence or presence of selective COX inhibitors. Preparations were studied in triplicate from each animal group: mature multigravid adult (MA, 4–6 months) female (MA F) (A) or age-matched male rats (MA M) (B), reproductively senescent (RS, 10–12 months) female (RS F) (C), or age-matched male rats (RS M) (D). Data points represent means ± SE (n = 6 rats/group). (a-f) 0.0001 ≤ P ≤ 0.02, mean values without common superscript differ significantly at middle and maximal concentrations of VP. In RS M, there were no significant differences among CTL, SC560, and NS398 groups.
