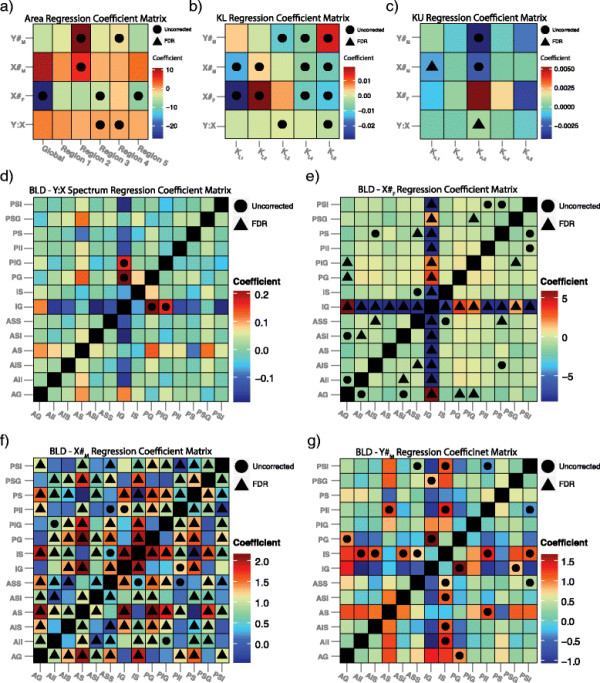
Figure 5.

Summary of chromosome dosage-metric associations. Coefficient matrices of the associations between the (a) area, (b) lower boundary curvature, (c) upper boundary curvature and (d-g) between-landmark distance and the (1) Y:X ratio spectrum, (2) number of X-chromosomes within female karyotypes (X#F), (3) number of X-chromosomes within male karyotypes (X#M), and (4) number of Y-chromosomes within male karyotypes (Y#M). The interpretation of the coefficient in each intersection is simply that for every unit increase in the given spectrum, the metric of interest changes by the amount given by the coefficient (e.g., for every extra X chromosome in the male karyotype, the global area of the callosum decreases by approximately 8 mm2). A circle is placed in intersections containing coefficients significant at the 0.05 level prior to correction for multiple comparisons while a triangle is present for coefficients significant after FDR correction.
