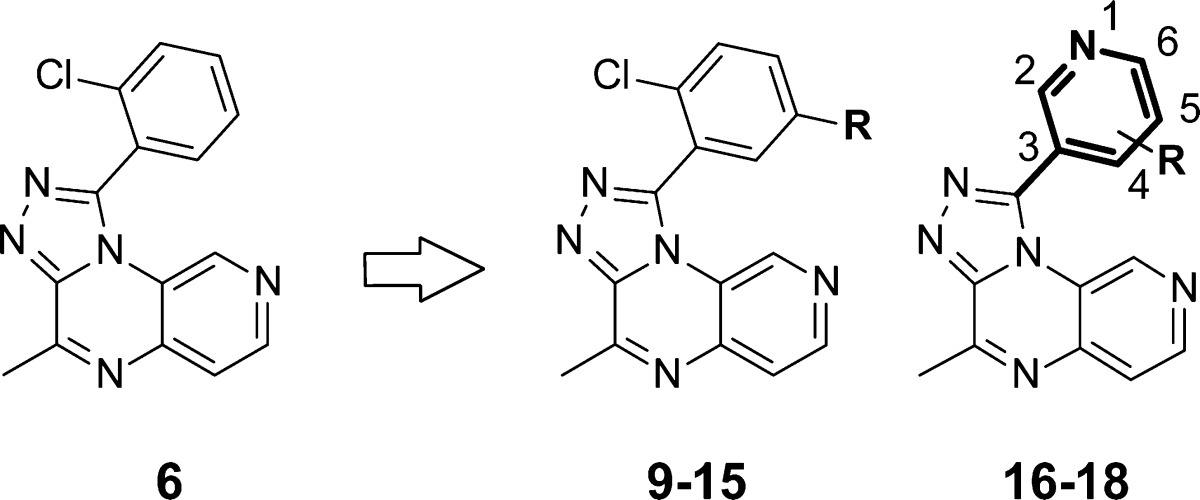
Table 3. In Vitro PDE2 and PDE10 Inhibition and Metabolic Stability Data for Compounds 6 and 9–18.

| R | hPDE2 IC50 (nM)a | rPDE10 IC50 (nM)a | rLMb | hLMb | |
|---|---|---|---|---|---|
| 6 | H | 29 | 480 | 13 | 7 |
| 9 | On-Bu | 6 | 5500 | 98 | 34 |
| 10 | O(CH2)2OMe | 95 | 9120 | 18 | 5 |
| 11 | CH2On-Pr | 21 | 3890 | 98 | 78 |
| 12 | CH2OCH2CF3 | 3 | 2450 | 77 | 12 |
| 13 | CH2Oi-Pr | 10 | 6030 | 98 | 57 |
| 14 | morpholine | 310 | >10000 | 53 | 14 |
| 15 | OCF3 | 150 | 8910 | 11 | 3 |
| 16 | 5-Cl | 5750 | n.m. | n.m. | n.m. |
| 17 | 4-Me | 2450 | n.m. | n.m. | n.m. |
| 18 | 5-On-Bu | 54 | 3800 | 46 | 6 |
Average value of at least two independent experiments.
Percent metabolized after incubating 1 μM solution 15 min with rLM or hLM at 37 °C.
