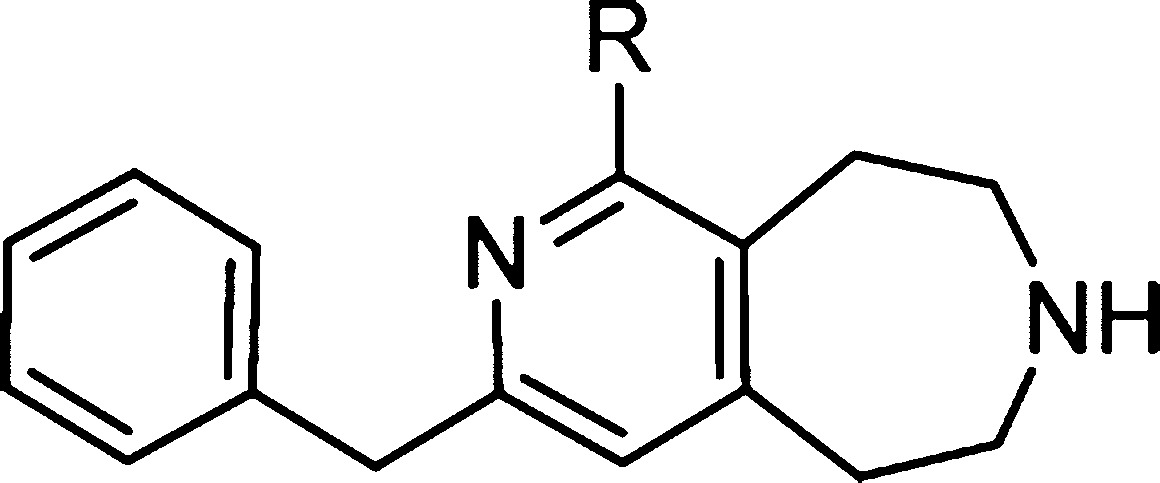
Table 2. 5-HT2C & 5-HT2B Activity, Microsomal Stability and in vitro Permeability Data for Compounds.

| 5-HT2C |
5-HT2B |
|||||||||||
|---|---|---|---|---|---|---|---|---|---|---|---|---|
| Cmpd | R | logD | EC50 (nM)a | Emaxa,b | Ki (nM)a | EC50 (nM)a | Emaxa,c | Kb (nM)a | HLM Clint (mL min–1 mg–1) | RRCK (×10–6 cm/s) | MDCK-MDR1 AB Papp (×10–6 cm/s) | MDCK-MDR1 ER (BA/AB) |
| 7 | NHMe | 0.4 | 9 | 99% | 3 | 1484 | 69% | 19 | 8 | 2.5 | 2.8 | |
| 21a | NHEt | 0.6 | 11 | 79% | 3 | 18 | 28% | 13 | 7 | 1.8 | 2.3 | |
| 21b | NHCH2iPr | 1.7 | 36 | 95% | 12 | nt | nt | nt | nt | nt | nt | |
| 21c | NHCH2cPr | 1.2 | 21 | 100% | 0.5 | 22 | 51% | 27 | 2 | 0.8 | 6.1 | |
| 21d | NHnPr | 1.0 | nt | nt | 4 | 27 | 38% | 11 | 4 | 1.5 | 3.5 | |
| 21e | NHiPr | 1.0 | nt | nt | 13 | 33 | 32% | nt | 12 | nt | nt | |
| 21f | NHBn | 1.7 | 158 | 37% | 22 | 121 | 35 | 2 | 0.6 | 3.6 | ||
| 21g | NMe2 | 0.6 | nt | nt | 12 | 30 | 38% | 43 | 8 | 2.1 | 2.2 | |
| 21h | H | 0.5 | nt | nt | 35 | 27 | 53% | <8 | 18 | 3.9 | 1.5 | |
Values are geometric means of up to five experiments. Differences of <2-fold should not be considered significant.
Percent activation by maximum asymptote at 10 μM relative to 5-HT.
Percent activation by maximum asymptote at 30 μM relative to 5-HT; nt denotes not tested.
