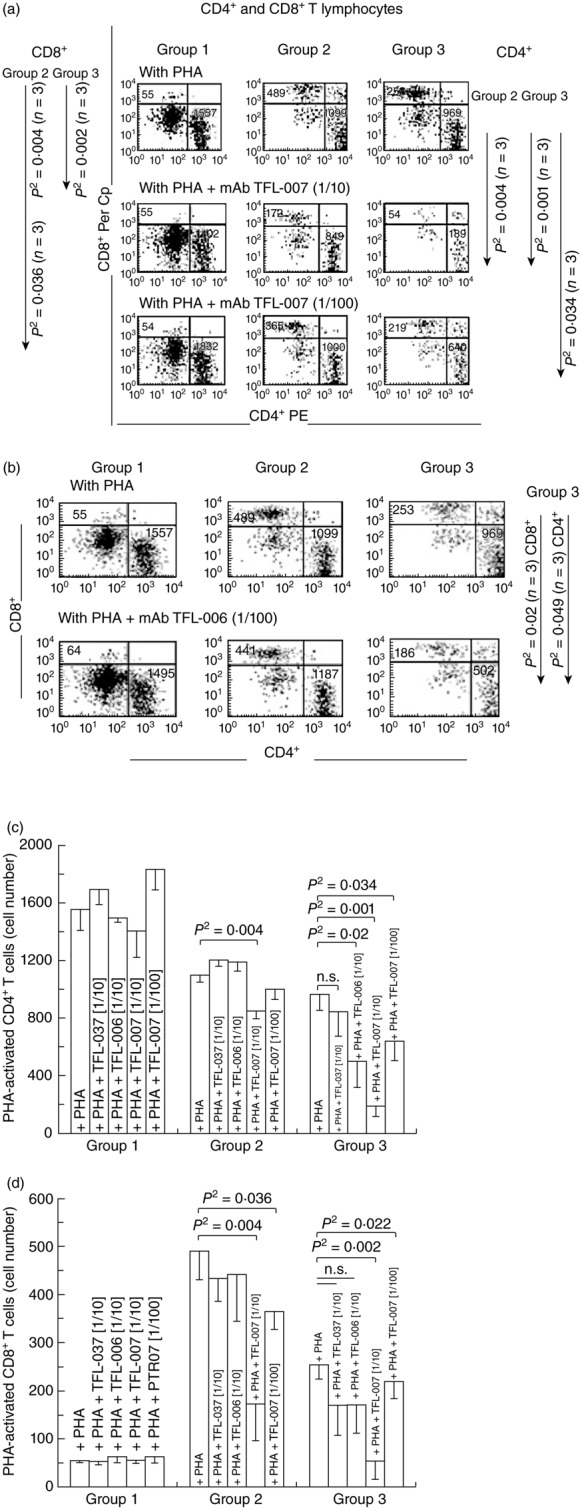
Fig 3.

Dose-dependent inhibition of phytohaemagglutinin (PHA)-activated CD4+/CD8+ T cells in vitro with two human leucocyte antigen (HLA) class I polyreactive anti-HLA-E monoclonal antibodies (mAbs), Terasaki Foundation Laboratory (TFL)-007s and TFL-006s; ‘s’ = culture supernatants. The T cells were stained with phycoerythrin (PE)-labelled anti-CD4 mAbs (x-axis) and peridinin chlorophyll (PerCP)-labelled anti-CD8 mAbs (y-axis). The profile is divided into three groups based on staining and size of cells to illustrate the differences in the CD4+ and CD8+ T cell populations and number of events. Group 1 comprises resting CD4+ and CD8+ lymphocytes, group 2 resting CD4+ and CD8+ lymphocytes and group 3 CD4+ and CD8+ lymphoblasts. (a) Flow cytometric profiles of PHA-treated CD4+ T cells (lower right of the boxes) and CD8+ T cells (upper left) from a normal non-alloimmunized donor (R) after treatment with mAb TFL-007s. Comparison of groups 1, 2 and 3 in the top row (treated only with PHA) shows that the number of CD4+ T cells in all three groups and the CD8+ T cells in groups 2 and 3 were high. The middle row (PHA and mAb TFL-007s at 1/10 dilution) shows that the number of both CD4+ and CD8+ T cells have decreased significantly in groups 2 and 3 (note the statistical profile on the right side). In comparison, the bottom row with the same treatment, but at 1/100 dilution, shows a dose-dependent decrease in the number of PHA-activated CD4+ and CD8+ T lymphocytes. Figure represents one analysis. (b) Flow cytometric profiles of PHA-treated CD4+ T cells (lower right of the boxes) and CD8+ T cells (upper left) from the same donor after treatment with mAb TFL-006s. The top row (only PHA) shows that the number of CD4+ T cells and CD8+ T cells in groups 2 and 3 were higher than when the cells were treated with PHA and mAb TFL-006s at 1/100 dilution. Indeed, with that treatment, the number of both CD4+ and CD8+ T cells in group 3 decreased significantly (see the statistical profile). Figure represents one analysis. (c) The density of the population of CD4+ T cell cultures with and without PHA, and after adding TFL-037s at 1/10 dilution, TFL-006s (1/10) and TFL-007s (1/10 and 1/100) to the PHA-treated CD4+ T cells. The values are expressed as the mean of triplicate analyses ± standard deviation (s.d.) and two-tailed P-values. The two-tailed P-values, if significant, are indicated by a horizontal line connecting the two groups. Groups 1 and 2 comprise resting CD4+ lymphocytes, and group 3 CD4+ lymphoblasts. Note that all groups of the PHA-activated CD4+ T lymphocytes remained unaffected by treatment with mAb TFL-037s, and that only group 3 decreased because of treatment with mAb TFL-006s. Both PHA-treated groups 2 and 3 decreased significantly after treatment with mAb TFL-007s at 1/10, but only PHA-treated group 3 showed significant decrease after treatment with mAb TFL-007s at 1/100 dilution. Clearly, both anti-HLA-E mAbs TFL-006s and TFL-007s significantly suppress PHA-activated CD4+ T lymphoblasts, although the dosimetric suppression byTFL-007s is more obvious. (d) The density of the population of CD8+ T cell cultures with and without PHA, and after adding TFL-037s at 1/10 dilution, TFL-006s (1/10) and TFL-007s (1/10 and 1/100). The values are expressed as in (c) (triplicate analyses), with division into the same three groups, but of CD8+ cells. Note that all groups of the PHA-activated CD8+ T lymphocytes remained unaffected by treatment with mAb TFL-037s or mAb TFL-006s, but that the cell populations of both groups 2 and 3 decreased significantly after by treatment with mAb TFL-007s at both 1/10 and 1/100. The anti-HLA-E mAbs TFL-007s showed significant dose-dependent suppression of PHA-activated CD8+ T lymphoblasts.
