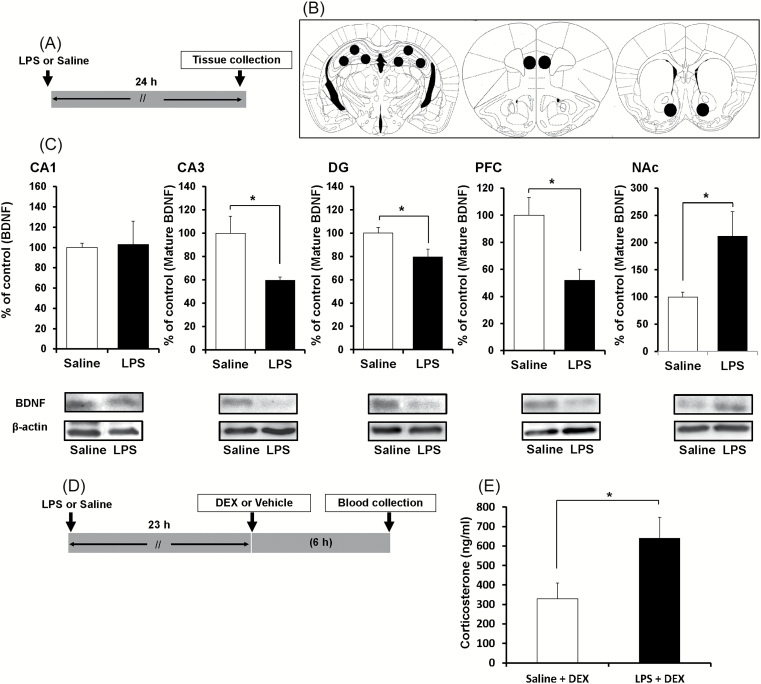
Figure 1.
BDNF protein in the brains of control and LPS-treated mice. (A): The schedule of treatment. (B): Brain regions (CA1, CA3, DG, PFC, NAc) for Western blot analysis of BDNF. (C): Western blot analysis of BDNF in the CA1, CA3, and DG of the hippocampus, the PFC, and the NAc. The value was expressed as a percentage of that of saline-treated mice. Values represent the mean ± standard error of the mean (SEM; n = 6). *p < 0.05 compared with saline treated groups (student’s t-test). (D and E): Dexamethasome (DEX) suppression test. (D): The schedule of treatment. (E): Blood sample was collected 6 hours after injection of DEX, and serum corticosterone was measured by ELISA. Data represent mean ± SEM (n = 11–12 mice per group). *p < 0.05 compared with saline-treated groups (student’s t-test). LPS: lipopolysaccharide; DG: dentate gyrus; PFC: prefrontal cortex; NAc: nucleus accumbens.

