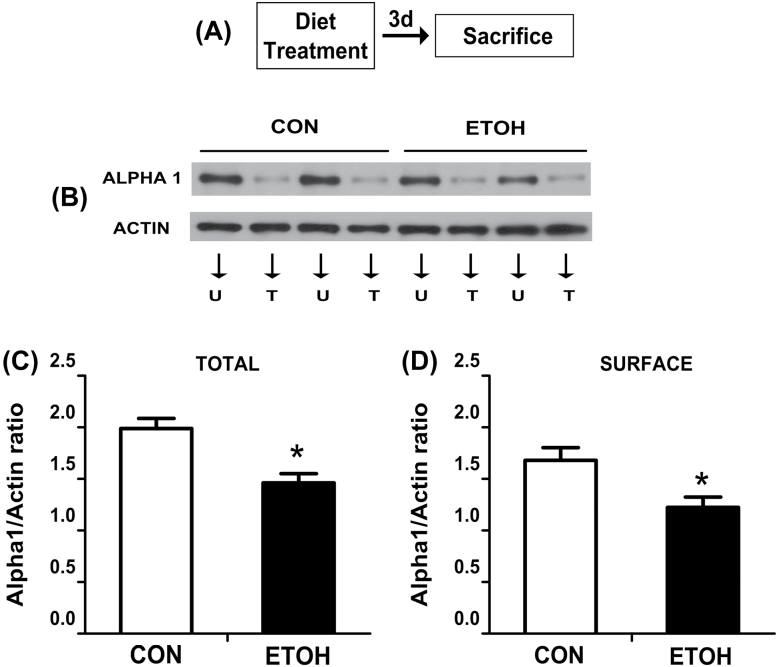
Figure 7.
Effect of ethanol withdrawal on total and surface protein expression of α1 GABAA-R subunit in the BLA.
(A) Timeline for Experiment 4. (B) Representative immunoreactive bands of total and surface α1 GABAA-R subunit and actin in the BLA from the CON and ETOH groups. (C) Bars represent the total expression of α1 in the BLA (n = 8/group). (D) Bars represent the surface expression of α1 in the BLA (n = 8/group). U, untreated portion; T, treated portion with bis(sulfosuccinimidyl)suberate. *Significantly different from the CON group (p < 0.05). BLA, basolateral amygdala; CON, control rats; ETOH, ethanol-withdrawn rats.

