Figure 3.
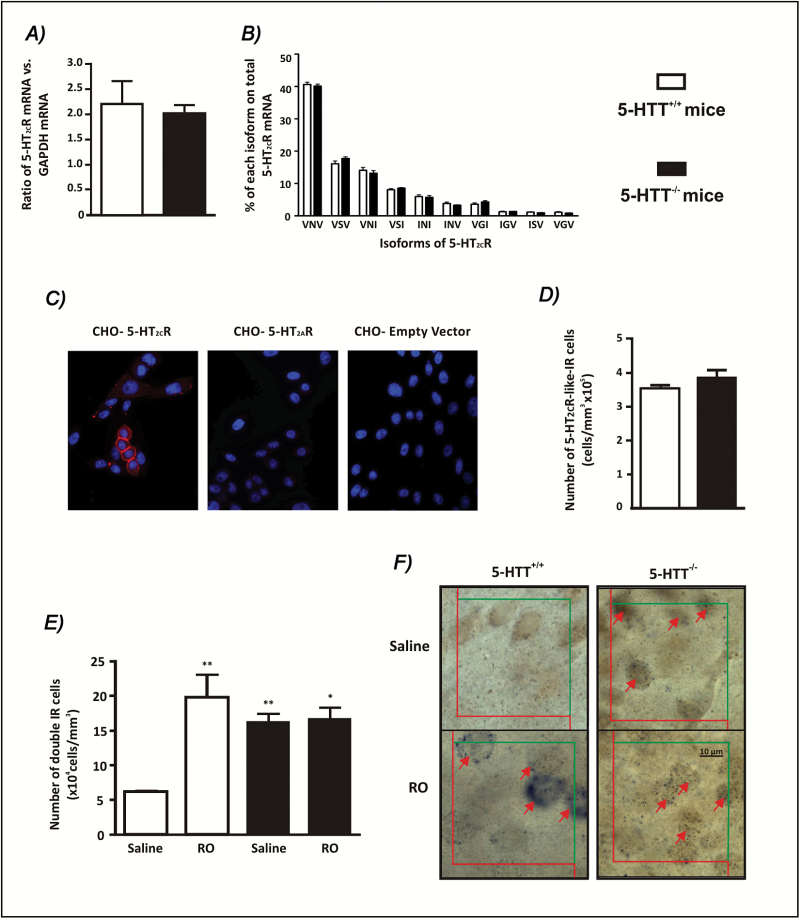
Cellular investigations of the apparent 5-HT2CR desensitization in the frontal cortex of mice lacking the 5-HT reuptake carrier (5-HTT-/-). The 5-HT2CR mRNA expression (A) and the quantitative distribution of 5-HT2CR mRNA isoforms expressed at more than 1% of total mRNA (B) are compared between 5-HTT-/- and 5-HTT+/+ (posessing the 5-HT reuptake carrier) mice. Values are mean ± standard error of the mean (SEM) of (A) total 5-HT2CR mRNA normalized to GaPDH mRNA (p > 0.05, student’s t-test, n = 9–10) and (B) respective percentages of various 5-HT2CR mRNA isoforms over total 5-HT2CR mRNA (n = 5–6; only values above 1% are represented). The two-way analysis of variance (ANOVA) indicated a difference between isoforms [F(9,90) = 1156, p < 0.0001], but no effect of genotype [F(1,90) = 0.1] and no interaction [F(9,90) = 1]. (C) To validate the Ab32172 antibody before its use in mouse cortical tissue, Chinese hamster ovary (CHO-K1) cells, which do not express 5-HT2AR or 5-HT2CR mRNA, were transiently transfected with either the 5-HT2CR (CHO-5-HT2CR) or 5-HT2AR (CHO-5-HT2AR) encoding vector or the empty vector (CHO-Empty Vector) and stained with Ab32172, followed by Alexa Fluor 555 secondary antibody (red) and counterstained with DAPI (blue). Significant immunofluorescence was observed in cells transfected with the 5-HT2CR, but not the 5-HT2AR or the empty vector. 5-HT2AR expression in 5-HT2AR-transfected CHO cells was confirmed by immunofluorescence using the 5-HT2AR antibody Ab16028 (data not shown). (D) The overall density of 5-HT2CR–like immunoreactive cells was determined in 5-HTT-/- mutants compared to 5-HTT+/+ mice. Values are mean ± SEM of the total number of 5-HT2CR–like immunoreactive cells/mm3. There was no difference in the volume of the region investigated between mutants and wild-type mice (5-HTT+/+ = 0.97±0.03mm3; 5-HTT-/- = 0.87±0.09mm3; means ± SEM, n = 6,). (E) Analysis of RO-60,0175–induced c-fos mRNA expression in 5-HT2CR–like immunoreactive cells, in 5-HTT+/+ and 5-HTT-/- mice. Two-way ANOVA indicated a significant effect of RO-60,0175 [F(1,8) = 13, p < 0.01] and no effect of genotype [F(1,8) = 3], but a significant RO-60,0175 x genotype interaction [F(1,8) = 11, p = 0.01]. The one-way ANOVA, followed by the Newman Keuls’ test, indicated further differences [F(3,8) = 9; p < 0.01]; *p < 0.05 and **p < 0.01 compared to saline-treated 5-HTT+/+ mice (n = 3). (F) Representative micrographs of double-stained cells (red arrows). 5-HT2CR–like immunopositive cells have brown deposits while digoxigenin-immunopositive cells have dark dots indicating the presence of c-fos mRNA (scale bar = 10 µm).

