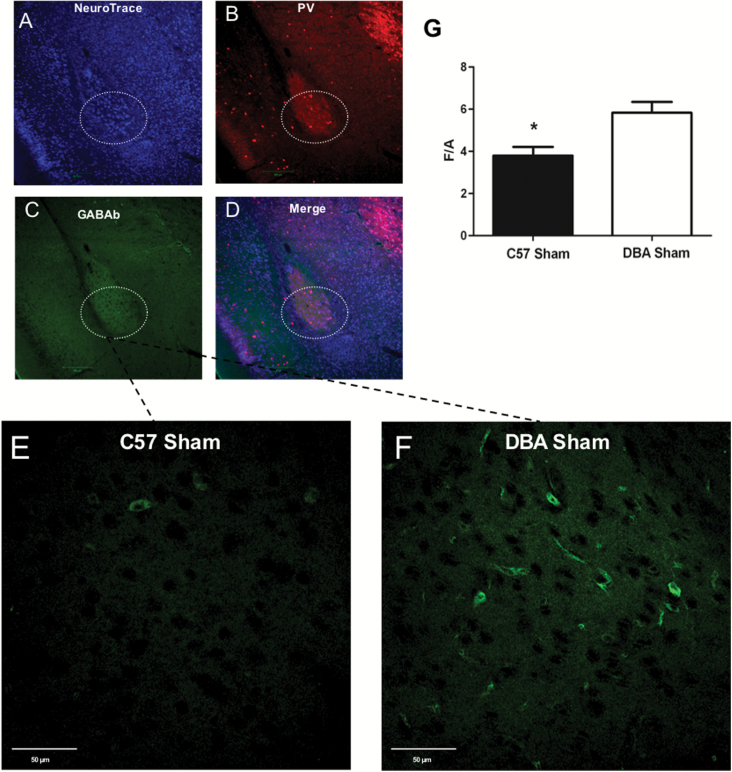
Figure 3.
GABAb immunoreactivity in the basolateral amygdala (BLA) of C57BL/6J (C57) sham and DBA/2J (DBA) sham. Triple-labeled confocal images of NeuroTrace counterstaining (A: blue), and parvalbumin labeling (B: red), GABAb (C: green) plus merged (D) of BLA. Panels E and F are higher magnification pictures from BLA of C57 (E) and DBA (F) reacted with GABAb antibody. Histogram of densitometric values (G) of GABAb immunofluorescence expressed as mean fluorescence of individual cells normalized to total cellular surface (F/A). Data are reported as means ± SD (n=6 animals/group). *P<.05. Scale bars: A-D=200 μm; E-F=50 μm.

