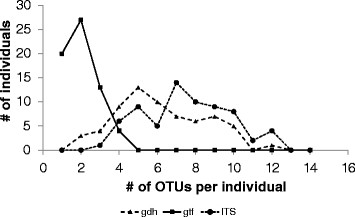
Figure 1.

Comparison of the number of different OTUs per individual among the genesgdh,gtf, and ITS. Results are depicted from the individuals of the seven countries CH, CO, DE, GE PH, PO, TU. CH = China, CO = Congo, DE = Germany, GE = Georgia, PH = Philippines, PO = Poland, TU = Turkey.
