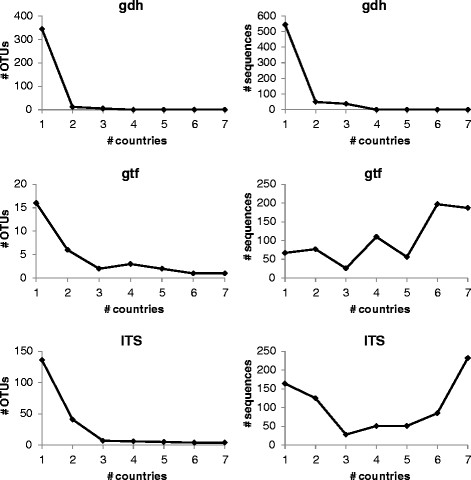
Figure 2.

Distribution of OTUs (left panel) and corresponding number of sequences (right panel) across countries. Results are depicted from the individuals of the seven countries CH, CO, DE, GE PH, PO, TU. CH = China, CO = Congo, DE = Germany, GE = Georgia, PH = Philippines, PO = Poland, TU = Turkey.
