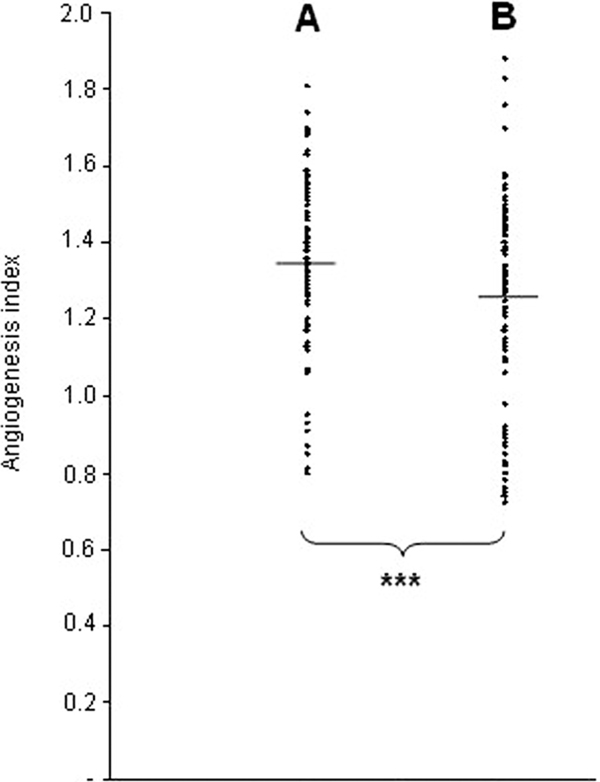
Figure 3.

Angiogenesis index in examined patients with DLCO > 80% of predicted value (A; n = 122) compared with those with DLCO < 80% (B; n = 94). The mean values are indicated by horizontal bars; ***P < 0.001 for the difference between the two groups.
