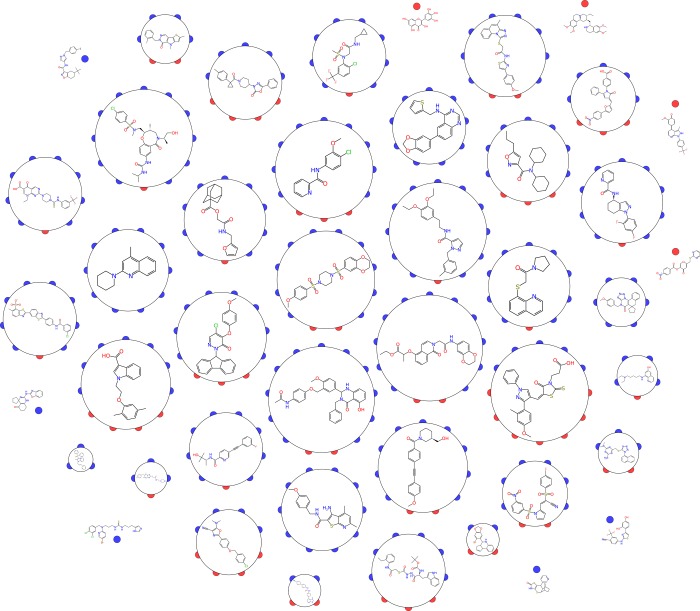
Figure 2.
Chemical structures for 322 NIH MLP probes (http://molsync.com/demo/probes.php) have been clustered into 44 groups for visualization purposes, using ECFP_6 fingerprints58 and using a Tanimoto similarity threshold of >0.11 for cluster membership. The threshold was chosen empirically in order to show a representative selection of the kinds of molecules found within the set of probes. For each cluster, a representative molecule is shown (selected by picking the structure within the cluster with the highest average similarity to other structures in the same cluster). The clusters are decorated with semicircles which are colored blue for compounds that were considered high confidence based on our medicinal chemistry due diligence analysis. This analysis suggests that there is not an obvious correlation between structural composition and whether they pass the medicinal chemist’s logic.30 Red is for those that are not. Circle area is proportional to cluster size, and singletons are represented as a dot.

