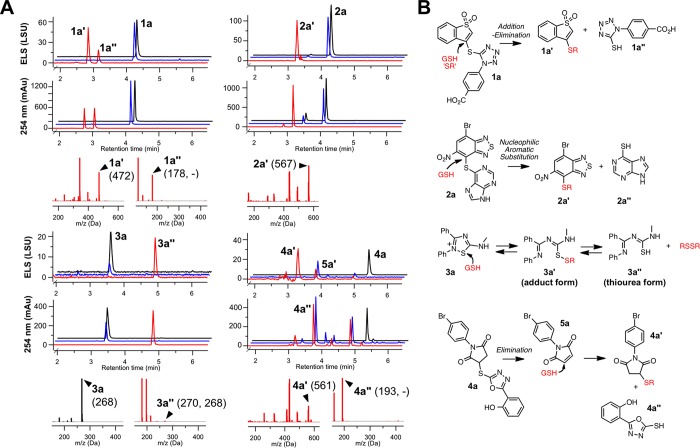
Figure 3.
Compound–GSH adducts detected by qualitative UPLC–MS. (A) Selected interference compounds were incubated with MeOH (black traces), HTS buffer (blue traces), or HTS buffer plus GSH (red traces) and analyzed by UPLC–MS. Shown are overlays of the simultaneous ELS and 254 nm traces. Selected mass spectra are also shown for a select sample in MeOH (black spectrum) and selected adducts (red spectra). Numbers in parentheses represent the predominant ion molecular weight (“–” denotes negative ion mode). Data are representative results from one of at least two independent experiments. (B) Simplified schematics of the proposed reaction mechanisms to generate the observed adducts.

