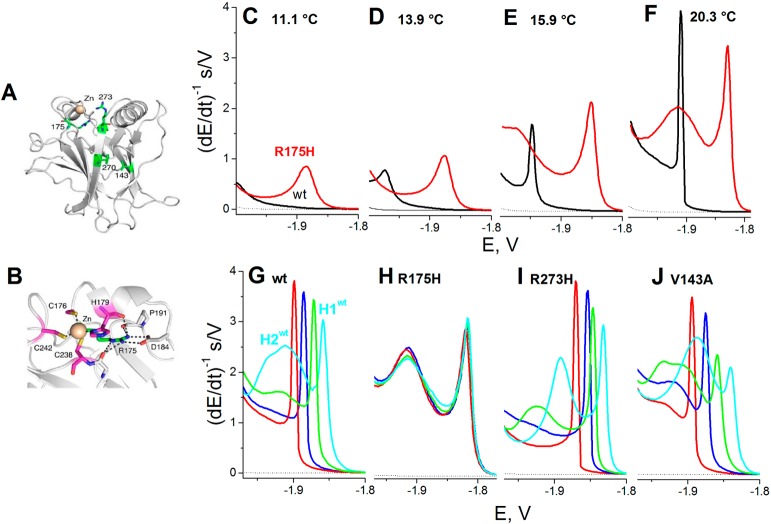
Figure 14.
Structure of DNA-binding domain of p53. (A) Overall structure of T-p53C (PDB entry 1UOL).101 Sites of cancer mutations investigated in this study (V143A, R175H, F270L, and R273H) are highlighted as green stick models. (B) Close-up view of the zinc coordination sphere, with the four zinc ligands shown in magenta. (C–F) CPS peak H of wild type T-p53C (black) and mutant R175H (red) at DTT-HMDE in 50 mM phosphate, pH 7 at (C) 11.1 °C, (D) 13.9 °C, (E) 15.9 °C, and (F) 20.3 °C. (G–J) CPS peaks H of (G) wt, (H) R175H, (I) R273H, and (J) V143A treated by 0 mM (red), 5 mM (blue), 10 mM (green), and 20 mM (cyan) EDTA at 0 °C for 10 min. CPS measurements were performed at 18 °C. Adapted with permission from ref (105). Copyright 2011 American Chemical Society.

