
Figure 15.
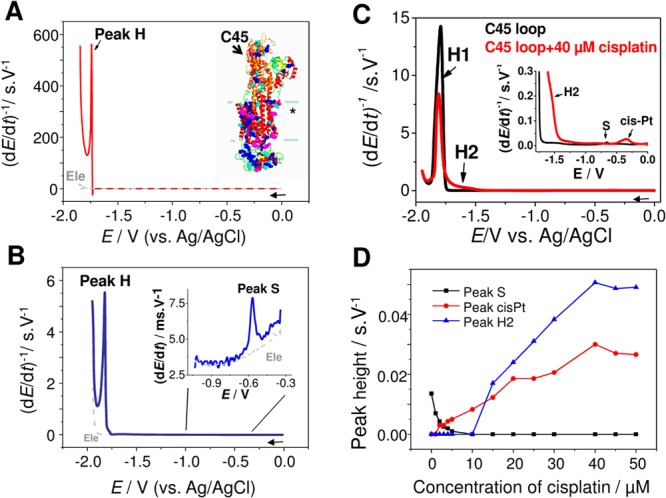
Chronopotentiograms of (A) Na+/K+-ATPase (NKA) and (B) its C45 loop. CPS experiment at HMDE, concentration of proteins: (A) 10 μM and (B) 500 nM, tA of 30 s; supporting electrolyte, Britton–Robinson buffer, pH 6.5; stripping current Istr, −10 μA. (C) CPS records of 5 μM C45 loop before (black) and after (red) incubation with cisplatin. (D) Dependence of peak heights (C45 peak S, C45 peak H2, and cis-Pt) on the concentration of cisplatin. Concentration of cisplatin (for C) was 40 μM, activated complex was used for all experiments. EC parameters: supporting electrolyte 0.2 M phosphate buffer, pH 7.4; tA of 30 s, Istr of −20 μA. “*” in inset of panel A: NKA transmembrane part. Adapted with permission from refs (410) and (412). Copyright 2012 Wiley-VCH Verlag GmbH&Co and 2012 Elsevier.