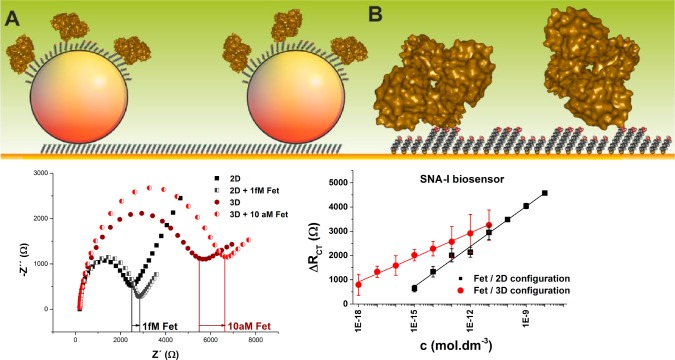
Figure 28.
A graphical representation drawn to scale of interfaces applied to build (A) the 3D biosensor based on integrated 20 nm gold nanoparticles or (B) the 2D biosensor (upper image). The 3D biosensor was built on a planar gold surface by chemisorptions of 11-aminoundecanethiol for attachment of 20 nm gold nanoparticles (spheres). (A) On every gold nanoparticle, a mixed SAM composed of 11-mercaptoundecanoic acid (MUA) and 6-mercaptohexanol was formed for covalent immobilization of lectin. (B) The 2D biosensor was formed by incubation of a planar gold with MUA and mercaptohexanol for covalent attachment of a lectin. In the lower part of the figure, comparison of the response of the 2D and the 3D biosensor to its analyte fetuin (Fet) with concentration close to the LOD, represented in a Nyquist plot (left), and calibration graphs for detection of fetuin (Fet) by both biosensors (right) are shown. Adapted with permission from ref (655). Copyright 2014 Enterprise Strategy Group.

