
Figure 6.
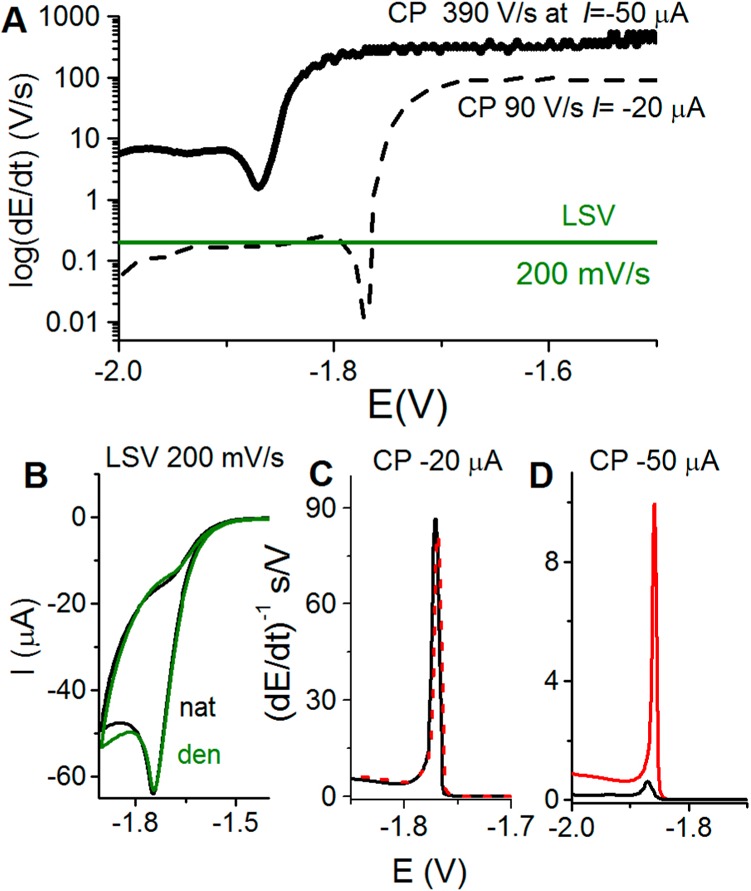
(A) Schematic representation of the rate of potential changes in chronopotentiometry (CP) at two different intensities as compared to voltammetry. In linear sweep voltammetry (LSV), the scan rate (chosen by an experimenter) is constant throughout the whole voltammogram recording. However, in CP the rate of potential changes is influenced by the current density. At constant electrode size, this density is determined by polarizing current intensity (I, chosen by an experimenter). In the absence of the electrode process, the potential changes very rapidly (e.g., 390 V/s at I = −50 μA), but it gets much slower in a narrow potential range where the electrode process (e.g., proton reduction and hydrogen evolution) is taking place. (B–D) In protein analysis, both native (nat, black) and denatured (den, green or red) proteins are firmly attached to the Hg electrode surface, and prolonged exposure of native folded protein to negative potentials (at low scan rates or I intensities) may result in its denaturation, indicated by almost the same (B) LSV or (C) CP responses. (D) At high current intensity in CP, for example, at I = −50 μA, fast potential changes (390 V/s) prevent protein from the denaturation at the negatively charged electrode surface, as indicated by a relatively small CP response of native (black) protein and a very large response of the denatured (red) protein.