. 2014 Sep 25;3:e03430. doi: 10.7554/eLife.03430

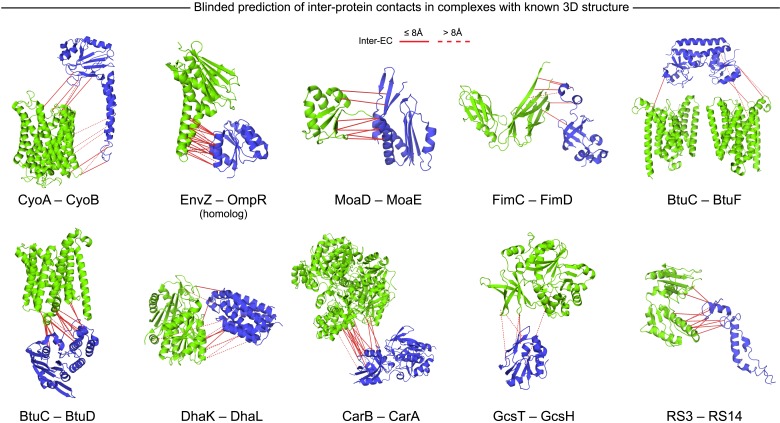
Figure 3. Blinded prediction of evolutionary couplings between complex subunits with known 3D structure.

Inter-ECs with EVcomplex score ≥0.8 on a selection of benchmark complexes (monomer subunits in green and blue, inter-ECs in red, pairs closer than 8 Å by solid red lines, dashed otherwise). The predicted inter-ECs for these ten complexes were then used to create full 3D models of the complex using protein–protein docking. For the fifteen complexes for which 3D structures were predicted using docking, energy funnels are shown in Figure 3—figure supplement 1.

DOI: http://dx.doi.org/10.7554/eLife.03430.015

Figure 3.

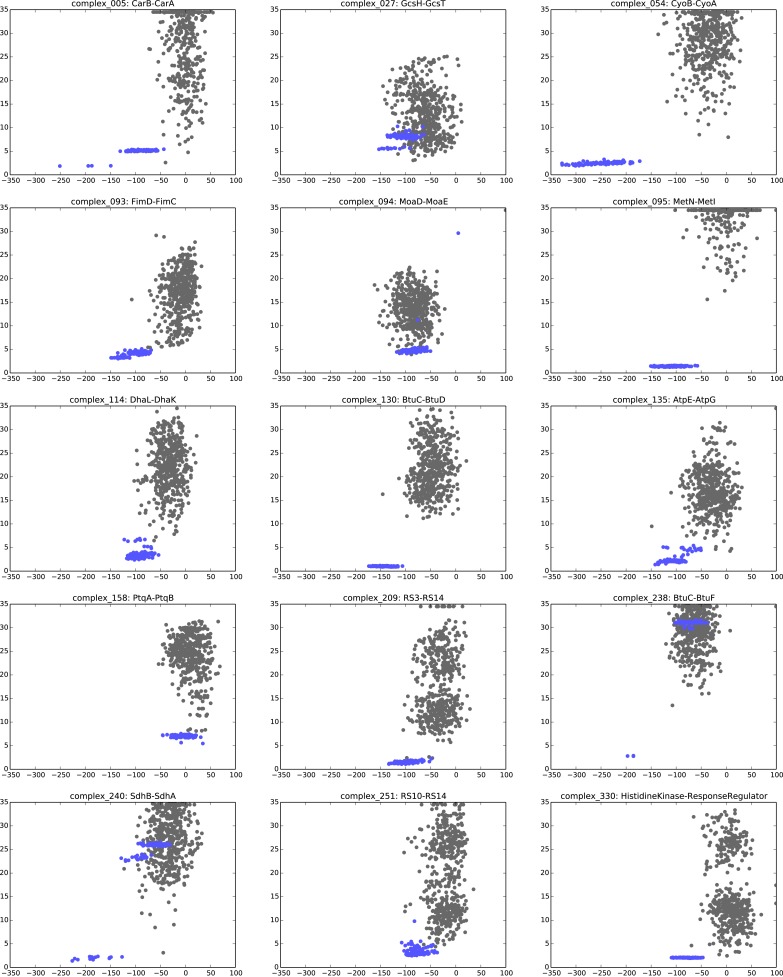
Figure 3—figure supplement 1. Comparison of Interface RMSD to HADDOCK score.

Figure 3—figure supplement 1.

The HADDOCK scores of docked models are plotted against their iRMSDs to the bound complex crystal. Gray data points correspond to models created without any ECs as unambiguous restraints whereas blue dots correspond to model created using all inter-couplings with EVcomplex score ≥0.8. HADDOCK score outliers with scores >100 are not shown, and any model with an iRMSD >35 Å is displayed as iRMSD = 35 Å for visualization purposes.