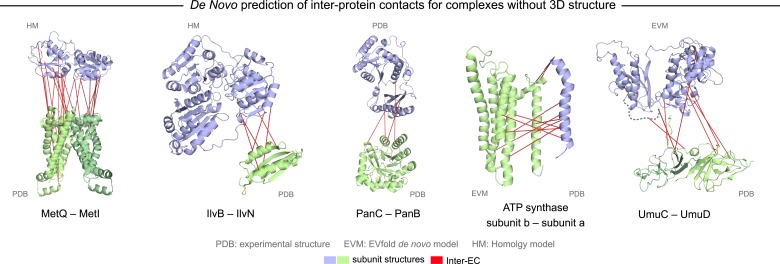
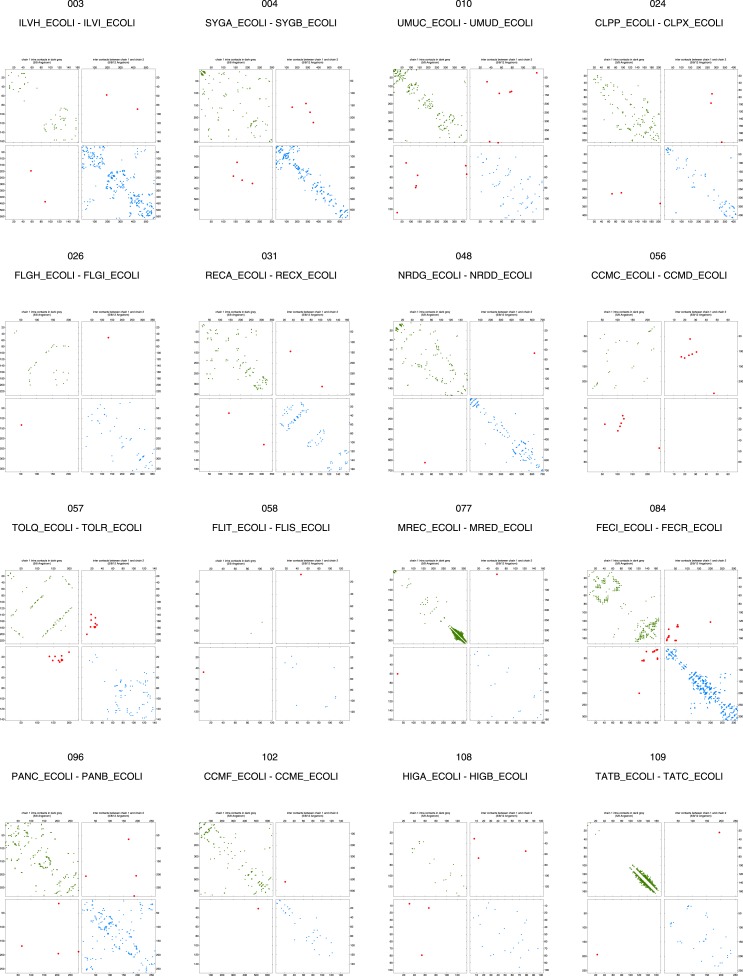
Figure 5. Evolutionary couplings in complexes of unknown 3D structure.
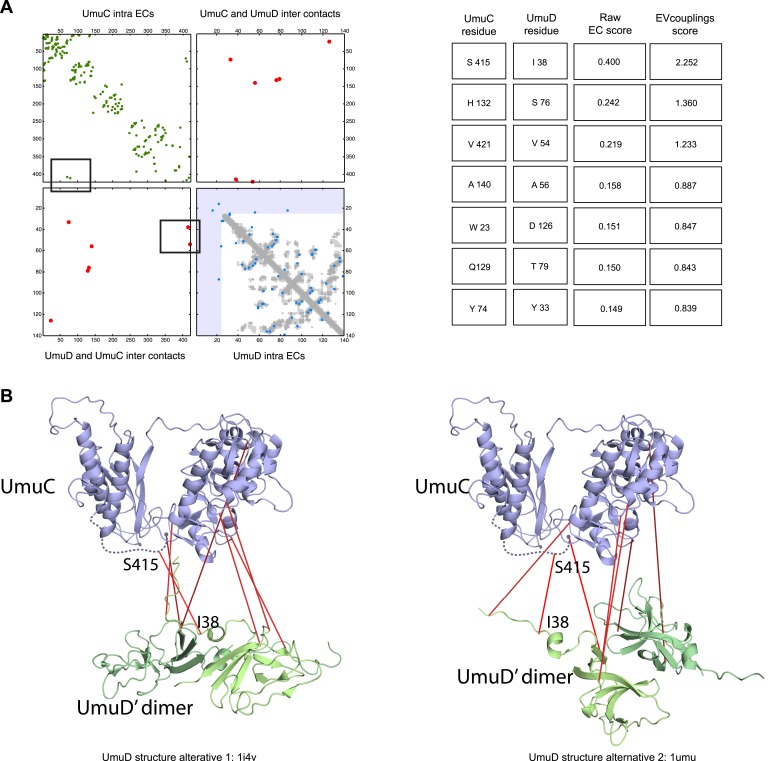
Inter-ECs for five de novo prediction candidates without E. coli or interaction homolog complex 3D structure (Subunits: blue/green cartoons; inter-ECs with EVcomplex score ≥0.8: red lines). For complex subunits which homomultimerize (light/dark green cartoon), inter-ECs are placed arbitrarily on either of the monomers to enable the identification of multiple interaction sites. Contact maps for all complexes with unsolved structures are provided in Figure 5—figure supplement 1 and 2. Left to right: (1) the membrane subunit of methionine-importing transporter heterocomplex MetI (PDB: 3tui) together with its periplasmic binding protein MetQ (Swissmodel: P28635); (2) the large and small subunits of acetolactate synthase IlvB (Swissmodel: P08142) and IlvN (PDB: 2lvw); (3) panthotenate synthase PanC (PDB: 1iho) together with ketopantoate hydroxymethyltransferase PanB (PDB: 1m3v); (4) subunits a and b of ATP synthase (model for a subunit a predict with EVfold-membrane, PDB: 1b9u for b subunit), for detailed information see Figure 6; and (5) the complex of UmuC (model created with EVfold) with one possible conformation of UmuD (PDB: 1i4v) involved in DNA repair and SOS mutagenesis. For alternative UmuD conformation, see Figure 5—figure supplement 3.


