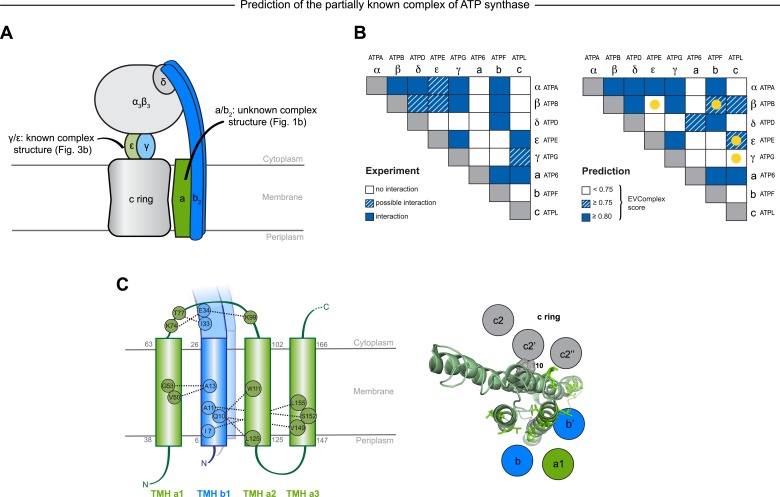
Figure 6. Predicted interactions between the a-, b-, and c-subunits of ATP synthase.
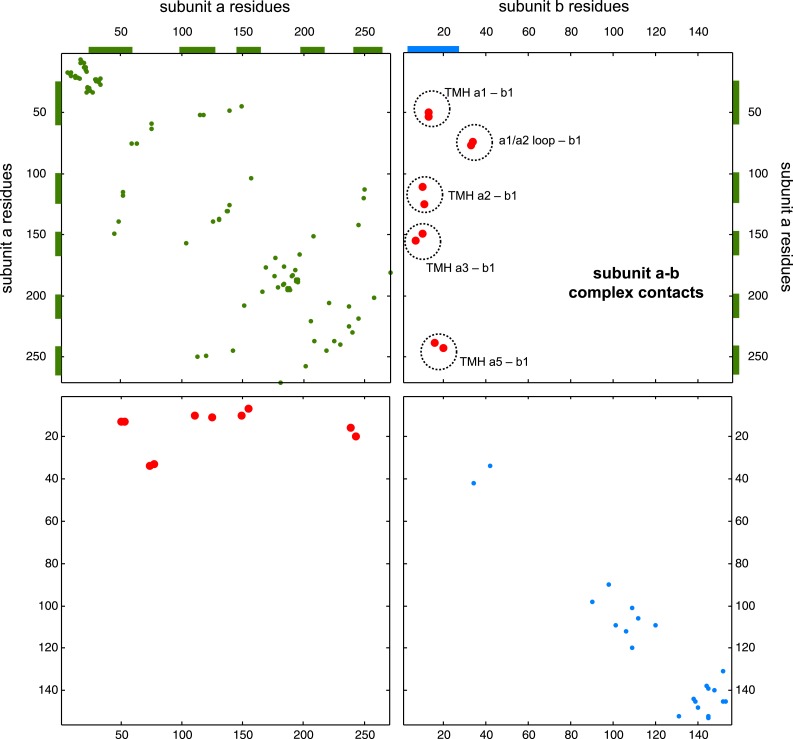
(A) The a- and b- subunits of E. coli ATP synthase are known to interact, but the monomer structure of subunits a and b and the structure of their interaction in the complex are unknown. (B) EVcomplex prediction (right matrix) for ATP synthase subunit interactions compared to experimental evidence (left matrix), which is either strong (left, solid blue squares) or indicative (left, crosshatched squares). Interactions that have experimental evidence, but are not predicted at the 0.8 threshold are indicated as yellow dots. (C) Left panel: residue detail of predicted residue–residue interactions (dotted lines) between subunit a and b (residue numbers at the boundaries of transmembrane helices in gray). Right panel: proposed helix–helix interactions between ATP synthase subunits a (green), b (blue, homodimer), and the c ring (gray). The proposed structural arrangement is based on analysis of the full map of inter-subunit ECs with EVcomplex score ≥0.8 (Figure 6—figure supplement 1).


