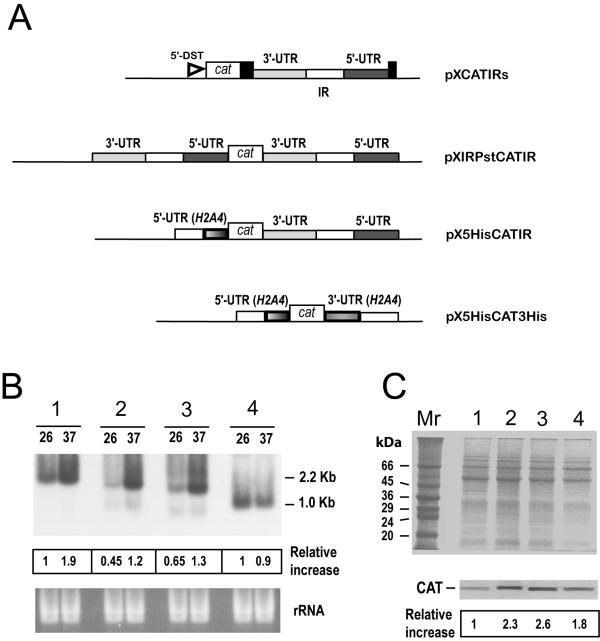
Figure 5.
Analysis of the expression of cat transcripts and CAT protein in the different transfected Leishmania cell lines. (A) Schematic maps of the constructs. The CAT coding gene (open box) was cloned between different 5'-UTRs and 3'-UTRs. Where not indicated, the UTRs are derived from L. infantum HSP83 genes. Along with the UTRs, the corresponding IRs (open rectangles) were also included. The position of the L. major DST sequence (5'-DST) in construct pXCATIRs is indicated. (B) RNA samples from promastigotes transfected with pXCATIRs (1), pXIRPstCATIR (2), pX5HisCATIR (3), or pX5HisCAT3His (4), incubated for 2 h either at 26°C (lanes 26) or at 37°C (lanes 37), were assayed by Northern analysis using a cat probe. The bottom panel shows an ethidium bromide staining of the RNA samples loaded on the gel prior to transfer. The intensities of the hybridization bands were evaluated by densitometric analysis and expressed as a relative increase (giving an arbitrary value of 1 to the intensity found in lane 26 of pXCATIRs-sample). (C) SDS-PAGE and Coomassie blue staining of protein extracts (4 × 10⁶ cells per lane) from different promastigote lines grown at 26°C. The stable transfections used are: pXCATIRs (lane 1), pXIRPstCATIR (lane 2), pX5HisCATIR (lane 3), and pX5HisCAT3His (lane 4). The bottom panel shows a Western blot analysis; proteins were transferred to a nitrocellulose membrane and incubated with an anti-CAT antibody (dilution 1:1000). The intensity of the bands was quantified by densitometric scanning and the normalized relative signals (relative increase) are shown. Data represent mean values from two independent experiments.

