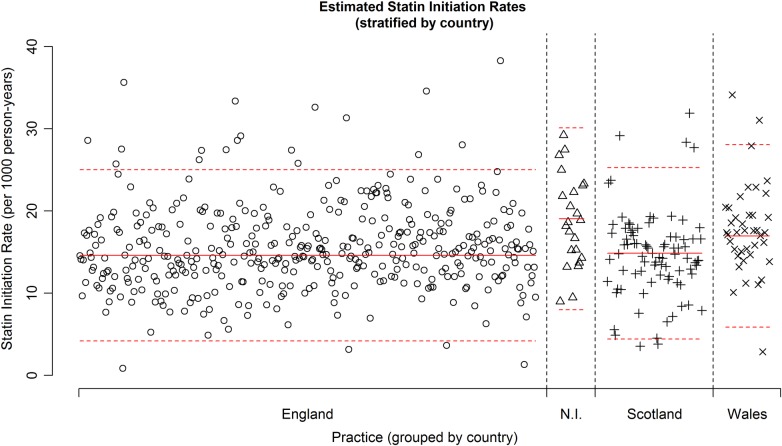
Figure 2.
Plot showing the estimated statin therapy initiation rate for each of the 554 general practitioner practices, stratified by UK country. The solid red line indicates the sample mean statin therapy initiation rate within a country. The dashed red lines indicate this sample mean ±2SD(sample SD) within a country.

