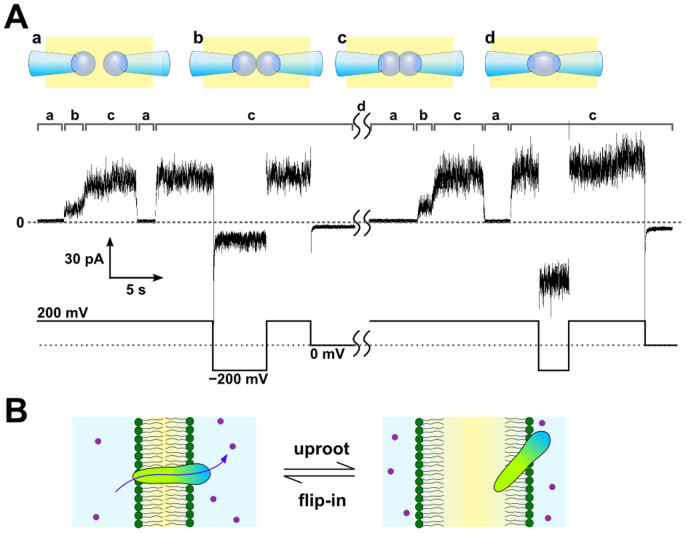
Figure 2. Channel activity of the pTB channel during the attach–detach process of the CBB.
(A) Time course of the channel current during the bilayer formation and detachment. Configurations of the bubbles (a–d) are illustrated above (upper panel). The time course of the bubble manipulation (indicated by the alphabet) and the corresponding current traces (middle panel) at the applied membrane potential (lower panel) are shown. pTB was added inside the right bubble (100 pM). Once the bilayer was formed (b), the pTB channels penetrated into the membrane with the same orientation, and the macroscopic current was detected immediately. As the two bubbles were pushed closer to each other (c), the membrane area increased, leading to a gradual increase in the current amplitude. Then, the two bubbles were separated from each other (a), and the current amplitude decreased to the null level. Reformation of CBB restored the macroscopic current of the pTB channel. After reformation, the channel orientation was not reversed, as shown by the asymmetric current amplitudes at ± 200 mV where the rectification factor (I+200mV/I−200mV) was 3.33 ± 0.03 (n = 4, ± SEM). Once the CBB broke by applying high voltage (e.g., 1 V) between two electrodes (d), the solution inside both bubbles mixed. After mixing, pTB penetrated into reformed CBB from both bubbles, which was confirmed by symmetric current amplitudes at ± 200 mV (right half period, rectification factor was 1.06 ± 0.09, n = 6, ± SEM). The aqueous buffer contained 3 M CsCl and 10 mM HEPES, and the pH was adjusted to 7.5. (B) Schematic illustration of the pTB channel during the attach–detach process.

