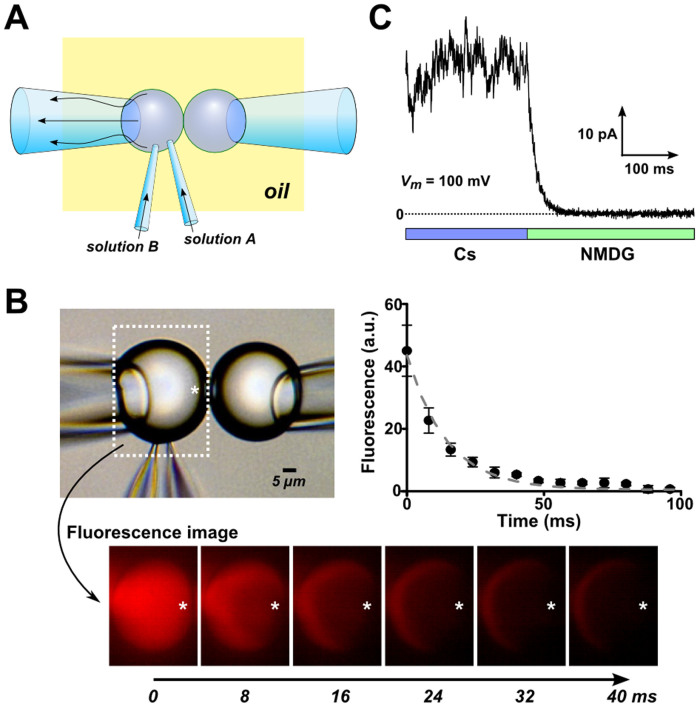
Figure 4. Perfusion of the CBB.
(A) Schematic illustration of the solution exchange inside the bubble. Two glass pipettes penetrated a bubble, and different solutions were injected from the two pipettes. The pressure inside the bubble-holding pipette was adjusted to keep the size of the bubble constant. Therefore, the flow from the injection pipettes was drained toward the bubble-holding pipette. (B) Visualization of the perfusion inside the bubble by use of fluorescence probe. The left bubble contained fluorescence probe and non-fluorescence solution started to flow from the injection pipette at time zero. Snapshots of the fluorescence image during perfusion were shown below. Fluorescence intensity inside the bubble at the indicated position (*) was quantified from the snapshots and the time course was presented on the right side. Decay time constant of the fluorescence intensity was 14.4 ± 0.4 ms (n = 3, ± SEM). (C) Typical time course of the current through the pTB channel. The pTB channel was incorporated into the CBB, and the macroscopic current was measured in the symmetrical CsCl solution at 100 mV. Then, the solution was changed to the NMDG-Cl solution, and the current decayed as the Cs was washed out with a time constant of 17.7 ± 1.7 ms (n = 5, ± SEM).

